A founder opens the store dashboard and sees a healthy-looking revenue line. The ad account reports strong returns, the campaigns are spending, and the growth forecast looks optimistic. Then the bank balance moves in the opposite direction.
That disconnect usually starts with an incomplete definition of profitability. Break even ROAS is the return required for advertising revenue to cover the variable costs of fulfilling the sale, not merely the point where a platform credits itself with revenue. The difference between those two views can determine whether you scale a campaign or shut it off.
A dashboard can hide contribution-margin erosion from shipping, payment fees, packaging, fulfillment, and returns. Privacy changes and weaker attribution can make platform-reported ROAS look cleaner than the underlying economics. The practical question is no longer only “What's my break even ROAS?” It's “Which measurement view reflects profitable, incremental revenue?”
The Hidden Gap Between Reported Profit and Real Profit
A founder checks Shopify and sees $80,000 in attributed Meta revenue against $25,000 in spend, producing a tidy 3.2 ROAS. On paper, that should support growth. Yet the bank account keeps shrinking because the reported revenue line doesn't show what remains after the costs attached to those orders.
That's the first distinction to make. ROAS equals attributed revenue divided by ad spend. Break even ROAS asks whether the revenue left after variable fulfillment costs can cover the ad spend. One is a reporting ratio. The other is an operating threshold.

Start with contribution profit
Gross margin can provide a useful first pass, but it often leaves out costs that rise with every sale. A more realistic contribution calculation subtracts:
- Product cost: Materials, manufacturing, or supplier charges.
- Fulfillment costs: Shipping, packaging, warehouse handling, and order labor.
- Transaction leakage: Payment processing and other sale-level fees.
- Post-purchase exposure: Returns, refunds, and the operational cost of handling them.
Recent break even ROAS guidance increasingly uses contribution margin because these costs can materially change the threshold. A product that appears viable at a 2.0 ROAS can still lose money once fees and returns are included, as explained in this contribution-margin break even ROAS analysis.
Then question the attribution
Privacy changes, browser restrictions, server-side gaps, and platform modeling can all weaken the connection between an ad impression and a recorded sale. That creates two opposite risks: a business may be profitable while platform ROAS looks weak, or it may be unprofitable while the platform reports a comfortable return.
Use platform ROAS for optimization signals, not as the final profit authority. Pair it with blended revenue analysis and incrementality testing to determine whether paid media is creating net-new demand or receiving credit for customers who might have purchased anyway.
Practical rule: Never approve additional budget because a platform number is green. Approve it because the contribution economics and the broader revenue picture support the decision.
The Break Even ROAS Formula and Why Simple Math Misses the Point
The textbook formula is a useful starting point:
Break even ROAS = 1 ÷ gross profit margin
If the gross profit margin is 40%, the basic calculation produces a 2.5 break even ROAS. That calculation works only when the margin includes every variable cost that belongs in the sale. If it reflects product cost alone, it gives the buyer a false sense of safety.
Build the denominator correctly
Start with revenue. Subtract product cost to reach gross profit, then divide gross profit by revenue:
Gross profit margin = (Revenue − product cost) ÷ Revenue
For contribution margin, continue subtracting variable costs:
Contribution margin = (Revenue − product cost − shipping − payment fees − packaging − fulfillment − returns reserve) ÷ Revenue
Then apply the same threshold logic:
Contribution-margin break even ROAS = 1 ÷ contribution margin
The algebra matters because every omitted cost increases the denominator, and a smaller denominator produces a higher required ROAS. If one catalog appears to have a 40% margin, the gross-margin threshold is 2.5. If overlooked costs reduce effective contribution margin to roughly 31%, the required threshold moves near 3.2. The product hasn't changed. The accounting view has.
| Cost Component | Gross Margin View | Contribution Margin View |
|---|---|---|
| Product cost | Included | Included |
| Shipping | Often omitted | Included |
| Payment processing | Often omitted | Included |
| Packaging and fulfillment | Often omitted | Included |
| Returns reserve | Often omitted | Included |
| Advertising spend | Compared after the margin calculation | Tested against the contribution threshold |
Recalculate by operating context
A single store-wide target is rarely precise enough. Shipping rates, payment costs, return behavior, and fulfillment economics can differ by channel, product line, and country, so each combination may need its own threshold. A country with expensive delivery or higher return exposure can make an otherwise acceptable campaign structurally unprofitable.
Use a contribution margin analysis to identify which costs belong in the calculation before setting targets. The formula is simple. The discipline lies in protecting the inputs from convenient omissions.
Worked Examples for a $50 Product and a $500 Service
Calculate contribution profit per sale before judging media performance. The result shows how much revenue remains available for advertising after variable costs, which is more useful than relying on a reported ROAS definition alone.
Example one, physical product
A product sells for $50. COGS equals 40% of revenue, or $20. Shipping costs $6, and payment processing costs $1.75. With a 12% return rate, reserve $6, or 12% of the sale value, for expected returns.
| Line Item | $50 Product | $500 Service |
|---|---|---|
| Selling price | $50 | $500 |
| Product or delivery cost | $20 COGS | Technician labor allocation |
| Shipping | $6 | Not applicable |
| Payment processing | $1.75 | Included in service transaction costs if applicable |
| Returns or qualification cost | $6 return reserve | $40 lead qualification |
| Other variable tools | Included in operating model | $35 software and dispatch tools |
| Contribution margin | Roughly 35% | 75% |
| Break even ROAS | Near 2.86 | About 1.33 |
The product leaves:
$50 − $20 − $6 − $1.75 − $6 = $16.25 contribution dollars
That equals a 32.5% contribution margin. It is close to the roughly 35% planning assumption, so the rounded break even ROAS is 1 ÷ 0.35, or near 2.86. The exact threshold should use the actual margin, not the rounded planning figure. Shipping, processing, and returns reduce the amount available for advertising before media spend is counted.
Channel costs can change the answer. Recalculate this product by channel and country if delivery charges, payment fees, return behavior, or attribution loss differ. A campaign that clears the threshold in one market may fail after those local costs are included.
Example two, local service
A $500 local service has variable technician labor as its primary delivery cost. Add $35 for software and dispatch tools and $40 for lead qualification. With an effective 75% margin:
1 ÷ 0.75 = approximately 1.33
The service can support a lower acquisition return because each collected job leaves more contribution to cover media. A booked lead still has to become revenue. Cancellations, weak qualification, geographic coverage, and close rates can reduce the amount ultimately collected.
Use actual transaction data in your own model. Replace every line with the costs for the relevant service, channel, and country. Do not apply a blended average when one offer or market has a different delivery, qualification, or payment structure. Recheck the threshold when variable costs or attribution quality change.
Break Even ROAS Benchmarks Worth Starting From
Benchmarks can help diagnose an account, but they can't replace unit economics. A high-ticket product with low returns behaves differently from a low-priced consumable, even when both businesses report similar gross margins. A subscription business also needs to connect acquisition economics to retention and payback rather than judging the first transaction in isolation.
The table below is a diagnostic framework, not a universal target. The ranges are qualitative starting points because no verified benchmark set here supports invented industry percentages or ratios.
| Business Model | Typical Gross Margin | Implied Break Even ROAS Floor | Reality-Check Multiple |
|---|---|---|---|
| Ecommerce | Varies widely by product, shipping, returns, and fulfillment | Calculate from contribution margin, not catalog averages | Compare platform ROAS with blended profitability |
| Lead generation | Depends on delivery labor, qualification, close rate, and lead quality | Calculate from collected revenue per acquired customer | Compare booked, qualified, and closed revenue |
| SaaS | Depends on hosting, support, processing, churn, and customer lifetime | Use contribution economics and an appropriate payback window | Compare acquisition cost with retained revenue |
| Local services | Often shaped by labor, dispatch, qualification, and service area | Calculate from collected job contribution | Compare lead source performance with actual sales |
Treat each row as a question
For ecommerce, ask whether discounts, shipping subsidies, packaging, and returns have been included. A high-ticket fashion offer may carry heavier return exposure than a repeat-purchase consumable, while a bundle can change both order value and fulfillment cost.
For SaaS, the first payment may not tell the full story. A $200 B2B SaaS ACV and a $50-per-month subscription require different assumptions about retention, support, and payback. The right threshold should reflect the revenue that remains after variable service costs and the period in which the business expects to recover acquisition spend.
For local services, reported lead revenue can be misleading if the team counts inquiries rather than collected jobs. Qualification costs, technician capacity, missed calls, and close rates belong in the operating view.
The benchmark is useful only after your cost stack has earned the right to be compared.
Stop treating platform ROAS as clean evidence
Privacy-related measurement changes have reduced the completeness of many conversion paths. iOS attribution loss, server-side gaps, and last-click credit can inflate or distort platform-reported ROAS, while advertising platforms optimize toward conversion signals that may be 20 to 40 percent incomplete, as discussed in this analysis of modern ROAS measurement.
That creates a difficult but manageable situation. A platform can under-credit paid media when conversions are lost, while it can also over-credit paid media when it claims conversions that would have happened without the ad. Neither problem is solved by staring harder at the same dashboard.
Use MER and incrementality together
Marketing Efficiency Ratio, or MER, equals total revenue divided by total ad spend. It is platform-agnostic, so it provides a blended check against channel-reported performance. MER won't tell you which campaign caused each sale, but it can reveal whether account-level growth and media investment are moving together.
Incrementality testing answers the harder question. It tests whether paid media creates additional revenue rather than harvesting existing demand. The most responsible 2026 decision framework combines:
- Contribution-margin break even ROAS for unit economics.
- MER for blended business efficiency.
- Incrementality evidence for causal confidence.
Any media buyer still optimizing to platform ROAS alone in 2026 is optimizing to a vanity metric that can erode margin over time. The green number deserves scrutiny, especially when reported conversions and actual cash collection diverge.
Building Your Own Break Even ROAS Calculator in a Spreadsheet
A useful spreadsheet doesn't need to be elaborate. It needs to force every sale-level cost into view and make the threshold easy to update when prices, fees, or fulfillment conditions change.
Create the input layer
Set up one row per product or service and add these columns:
- Product price or average order value
- COGS
- Payment processing fee percentage
- Shipping cost per order
- Average return cost as a percentage of revenue
- Discount rate
- Desired net margin
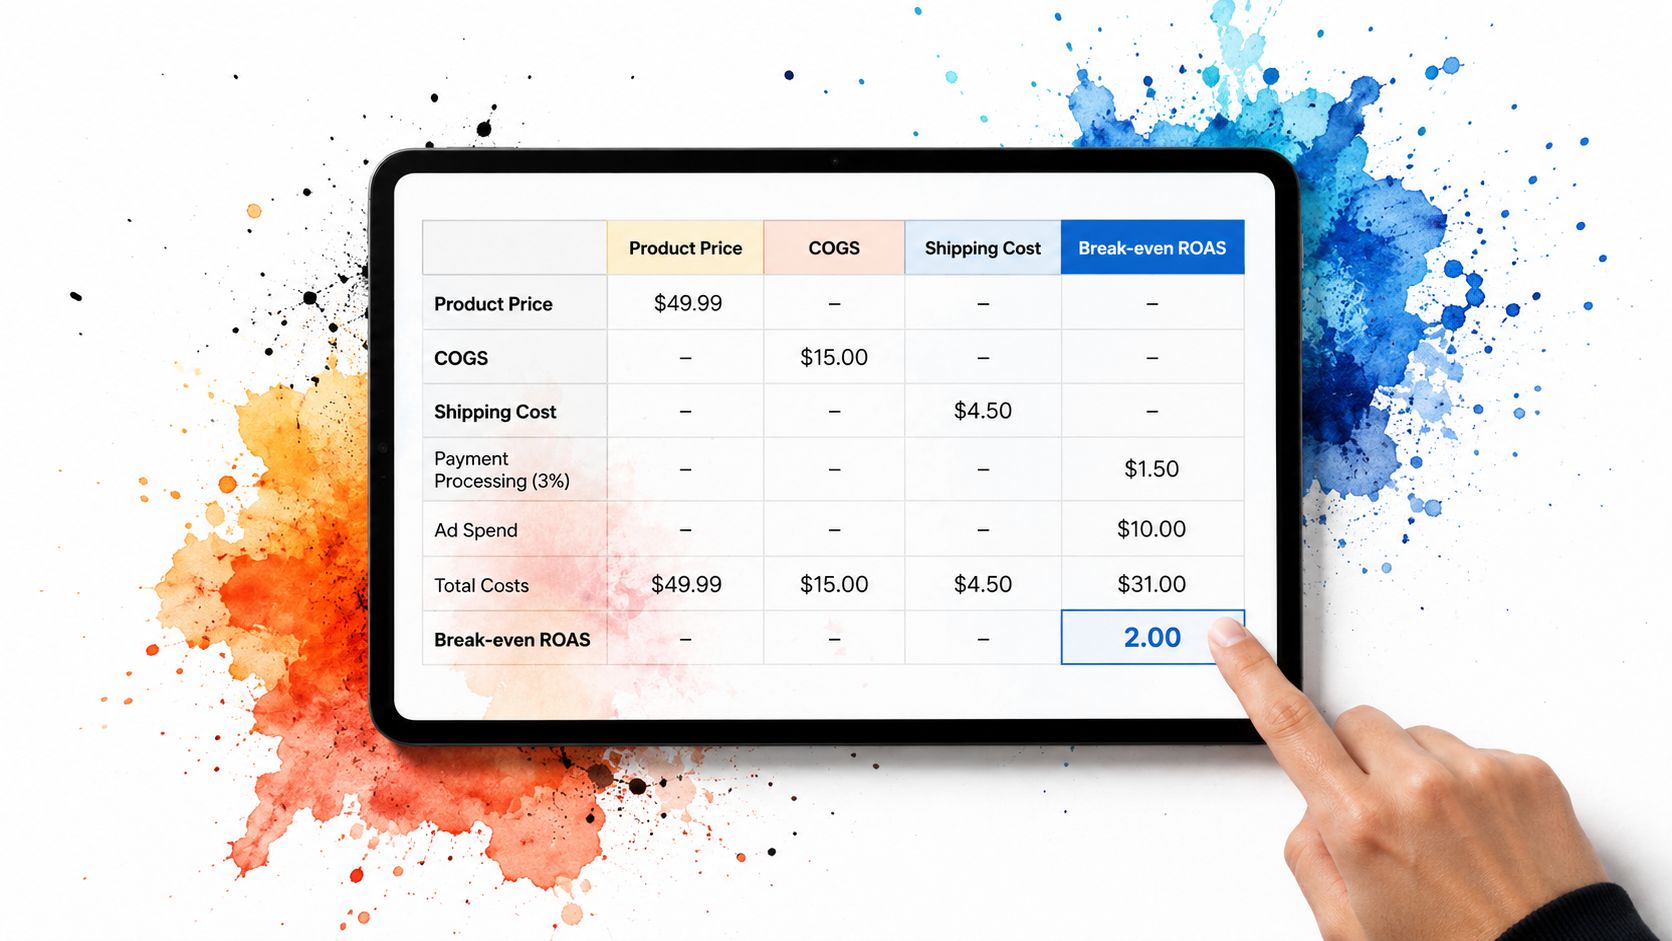
Then add calculation columns. A practical contribution-margin-per-order formula is:
Price − COGS − payment fee − shipping − return reserve − discount amount
Divide that result by price to get contribution margin. Divide 1 by contribution margin to get the break even ROAS.
Add the decision layer
Create separate columns for Meta, Google, TikTok, and email. The underlying product contribution can stay the same, but channel-specific costs and attribution assumptions should be visible rather than blended into one target. If a channel has different transaction costs, fulfillment arrangements, or discount behavior, reflect those differences in its column.
A mini-example makes the structure clear. If price is $50, COGS is $20, shipping is $6, payment fees are $1.75, returns reserve is $6, and discount cost is $2, the contribution dollars are:
$50 − $20 − $6 − $1.75 − $6 − $2 = $14.25
That is a 28.5% contribution margin, producing a break even ROAS of roughly 3.51. The exact output will change as your inputs change, which is why the sheet should use formulas rather than typed targets.
Break down the geography
Repeat the calculation by country when shipping, duties, payment costs, or returns differ. A brand may believe 2 is sufficient while a particular country or channel pushes break even ROAS into the 4 to 6 range. A reporting workflow can reduce manual errors, but the model still depends on accurate costs. Use reporting automation tools to keep the operating view current rather than relying on a stale monthly export.
Strategies That Improve Your Break Even ROAS
A campaign can show acceptable platform ROAS while losing money after returns, discounts, and fulfillment costs. Break even ROAS improves when contribution dollars rise, waste falls, or attributed revenue better reflects profitable demand. Treat those as separate workstreams, then measure each by channel and country.
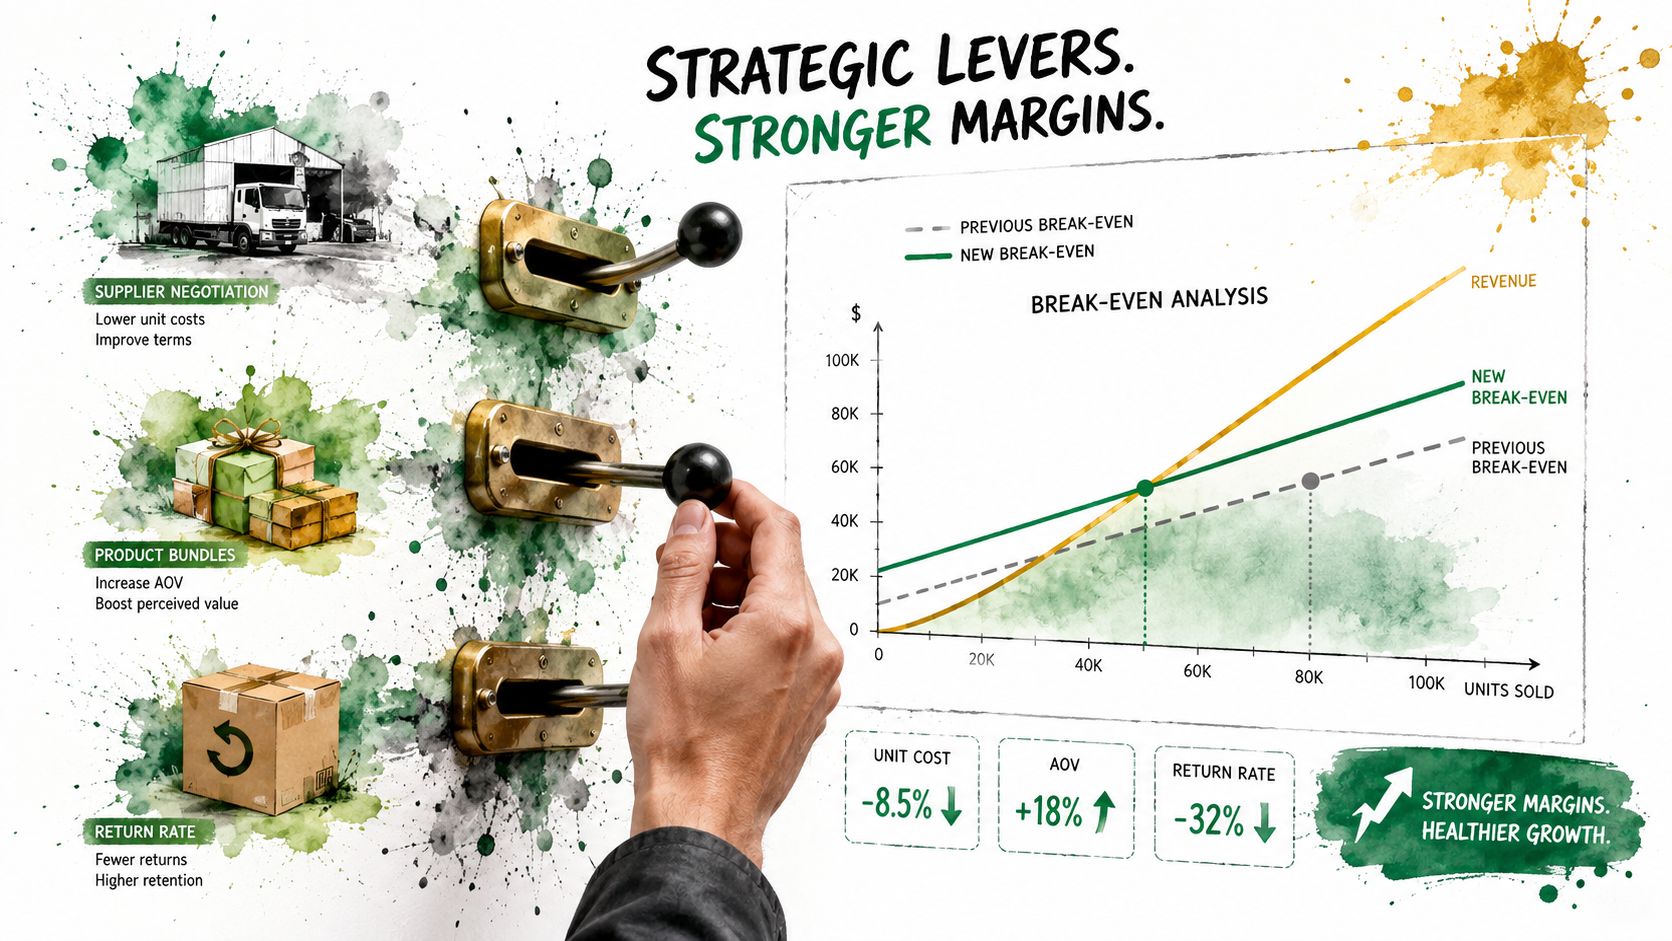
Fix contribution margin before forcing media efficiency
Start with costs tied to each transaction. Renegotiate supplier terms, remove avoidable packaging, and review fulfillment rules. Increase order value with bundles or complementary offers, provided the added items do not create disproportionate delivery or support costs. Reduce returns by improving product expectations, sizing guidance, demonstrations, and offer clarity.
A return avoided can be worth more than a click gained. Discounts require the same scrutiny. A promotion may improve conversion while reducing contribution, leaving the account busier but the business poorer. Recalculate contribution after every meaningful change to price, shipping, discounting, or service delivery.
Improve the conversion path and customer quality
Test the landing page with the same discipline applied to media. Page speed, offer hierarchy, price-anchored bundles, trust signals, and checkout friction all affect the economics of paid traffic. Give each test a hypothesis, success metric, review window, and record of what changed.
Creative testing also needs an economic filter. Refresh concepts before fatigue forces a recovery effort, test hooks and offers in structured batches, and shift budget toward creatives that produce profitable orders. Do not scale a creative solely because reported ROAS is high when its orders carry heavy returns, discounts, cancellations, or weak customer quality.
Cut spend that cannot clear the contribution floor
Review placement, geography, audience, and channel separately. A paused campaign can be more profitable than one that continues spending below contribution break even.
Channel-specific costs and attribution assumptions should remain visible. Meta, Google, TikTok, and email may differ in transaction costs, fulfillment arrangements, discount behavior, and conversion credit. Recalculate the floor for each channel and country instead of averaging them into one target. Attribution loss can make a channel look weaker than its blended contribution, while over-crediting can make an unprofitable channel appear efficient.
Use a spreadsheet or reporting workflow to track these inputs consistently. A structured ROAS improvement plan should address margin leaks first, conversion friction second, and budget allocation third. The sequence prevents ad optimization from masking broken unit economics. Each market needs its own threshold, review window, and decision rule.
Your 30 Day Plan to Put Break Even ROAS to Work
A break even ROAS target becomes useful when it changes weekly decisions. Use the first month to turn a static calculation into a repeatable operating loop.
Week one, inventory and recalculation
Pull every variable cost from invoices, payment records, fulfillment reports, service-delivery data, and return records. Calculate contribution margin by SKU or service, then set a break even ROAS for each channel, country, and platform. Export historical performance so you know which campaigns are already below the floor.
Week two, measurement reset
Install server-side tracking and server-side analytics where your stack supports them. Build a blended MER dashboard beside platform ROAS, then document where modeled conversions, missing signals, and last-click credit may distort interpretation.
Set a contribution-margin floor for each channel and a 1.3x target per channel as an operating target, not a universal industry benchmark. That target still needs to fit your cash cycle, customer quality, and growth priorities.
Week three, execution
Cut campaigns below break even for 14 consecutive days, redirecting spend toward stronger performers. Launch fresh creative tests with a hypothesis log that records the audience, offer, message, landing page, and decision rule.
Don't make a permanent decision from a single noisy day. Use consistent review windows and check whether revenue is collected, returned, qualified, or merely attributed.
Week four, review and systemization
Compare actual contribution against forecast. Record the result in one playbook, then lock a weekly cadence for creative refreshes, bid reviews, cost updates, and channel-level recalculation.
Break even ROAS isn't a quarterly exercise. It's a weekly operating metric. Managed that way, advertising becomes a compounding growth asset instead of a recurring cost center.
The Advertising Suite combines human-led media strategy, conversion rate optimization, omni-channel execution, and an integrated CRM and reputation ecosystem so your ad spend connects to collected revenue and customer experience. Request a growth consult through The Advertising Suite to review your contribution economics, measurement gaps, and channel-level break even ROAS with a growth-focused partner that works as an extension of your team.