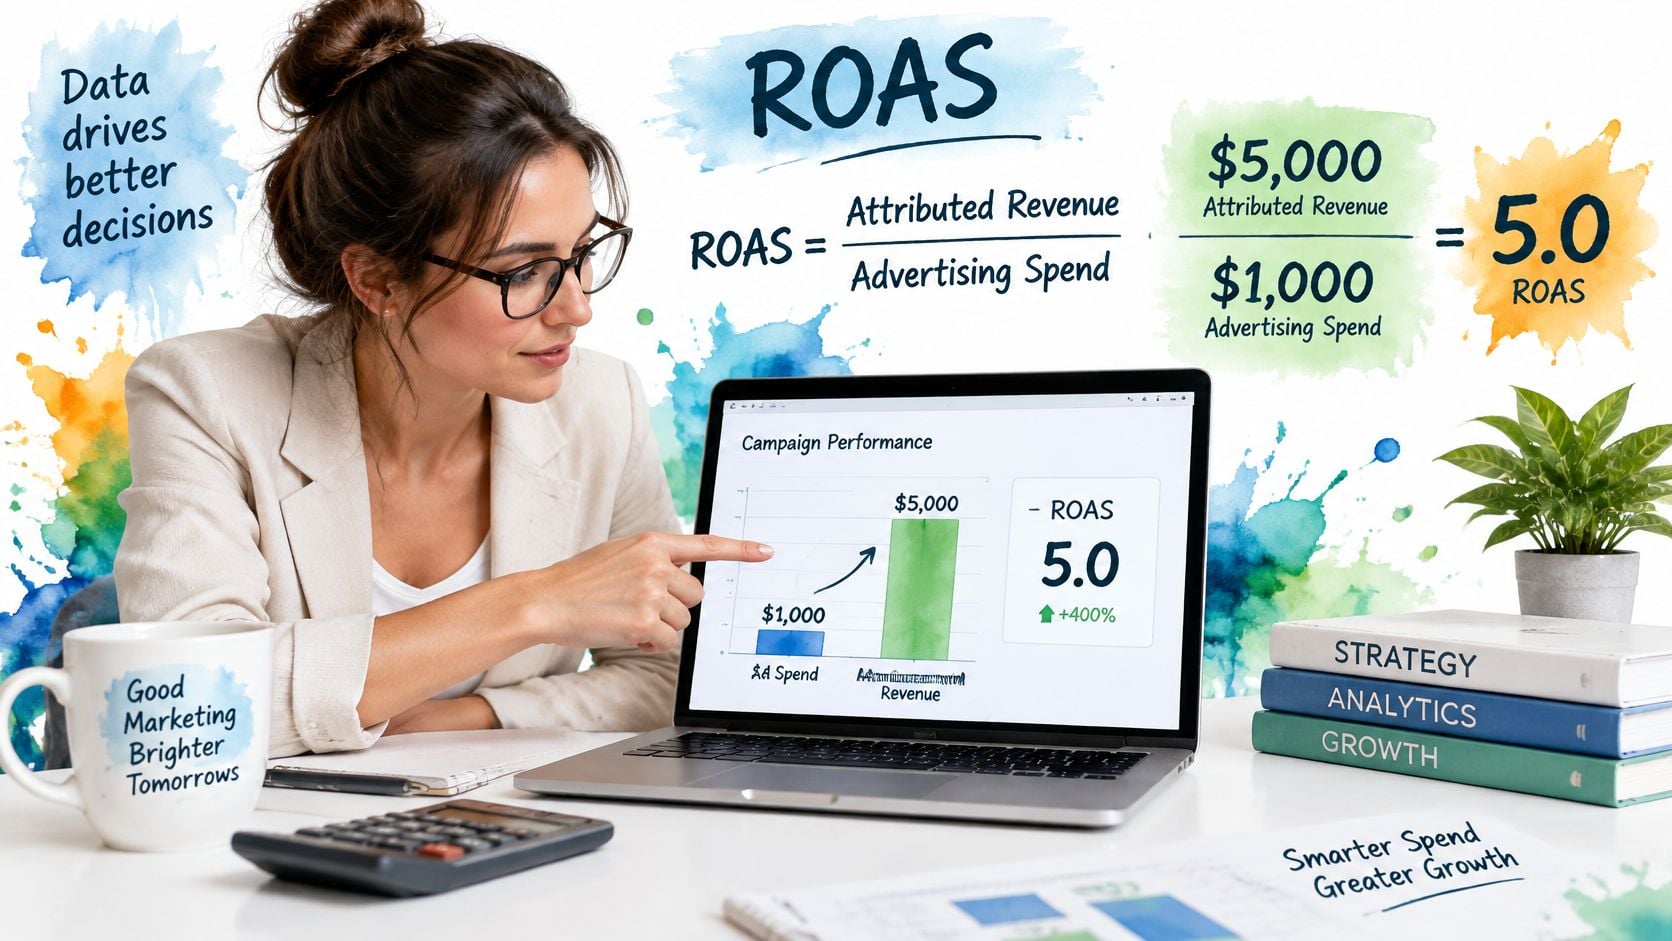
ROAS is attributed revenue divided by ad spend, so $5,000 from $1,000 is 5:1 or 500%, and that figure is not profit. It measures revenue efficiency, not how much money your business keeps.
The popular advice to chase the highest possible ratio misses the decision that matters: whether the next customer is worth what you paid to acquire them. A beautiful dashboard won't cover payroll if your margins can't support the campaign.
What ROAS Means for Every Ad Dollar
Return on ad spend, or ROAS, starts with a simple calculation: attributed revenue ÷ advertising spend. Using the revenue-to-cost approach described by Google Ads, a hypothetical campaign credited with $5,000 in revenue from $1,000 in advertising produces 5.0 ROAS, also written as 5:1 or 500%.
The calculation is $5,000 ÷ $1,000 = 5.0. In plain language, the campaign received credit for $5 in tracked revenue for every $1 invested in advertising.
How to Read Ratios and Percentages
The different formats don't represent different performance measures. They're different ways of displaying the same relationship between value and cost.
By the same arithmetic, 400% is 4:1, 300% is 3:1, and 200% is 2:1. A 100% result, or 1:1, means attributed revenue only equals the media expenditure. You've recovered the advertising dollar in revenue, but haven't covered the costs of delivering what you sold.
Don't subtract advertising spend from revenue before calculating ROAS. That changes the metric rather than making it a more accurate version of ROAS.
Why ROAS Isn't ROI
ROAS compares attributed revenue with ad cost. ROI evaluates profit against the broader investment. Product costs, fulfillment, discounts, agency fees, technology, and overhead all affect the financial outcome, even when they don't appear in the platform's ROAS calculation.
Keep media cost in the standard ROAS denominator, then evaluate the other expenses in your profitability analysis. Otherwise, your internal calculation and the advertising dashboard may carry the same label while measuring different things.
Practical rule: Use ROAS to judge revenue efficiency. Use contribution and profit to decide whether that efficiency is valuable.
How to Make the Calculation Usable
Before comparing campaigns, agree on these reporting rules:
- Match the date range. Measure value and spend over a consistent reporting period, while allowing for conversion delays.
- Keep attribution consistent. Don't compare campaigns using incompatible rules for assigning sales credit.
- Define conversion value. Decide whether you're counting completed order revenue, estimated qualified-lead value, or closed-sale revenue.
For ecommerce, completed purchases usually provide the clearest starting point. For a service business, a submitted inquiry and a paid job aren't interchangeable outcomes. Our guide to conversion tracking explains how to connect those actions to meaningful measurement.
So, what is ROAS useful for? It helps you compare campaigns, identify changes in revenue efficiency, and investigate where performance improved or deteriorated. It isn't a profit-and-loss statement.
ROAS Benchmarks That Put Your Number in Context
Published ROAS Benchmarks
| Benchmark | Figure | Revenue per $1 | What it covers |
|---|---|---|---|
| Ecommerce median, 2024 | 2.04 | $2.04 | Half of ecommerce brands generated less than this, according to Funnelytics |
| Google Ads search average, 2024 | 200% | $2.00 | Reported average across industries, published by Gitnux |
| LinkedIn, March 2025 | Highest measured | Exact value not provided | Highest ROAS among measured networks in Statista's comparison |
| Meta, March 2025 | Lowest measured | Exact value not provided | Lowest ROAS in that same network comparison |
| Revenue-only break-even | 100% | $1.00 | Formula-derived media recovery, before product cost and overhead |
A benchmark describes other businesses. It doesn't set the target for yours. A median identifies the middle result, while an average can be influenced by unusually high or low performers.
The network rankings also don't tell you which channel will work best for your business. The available comparison doesn't supply exact percentages, and a ranking alone doesn't explain customer quality, margins, or acquisition strategy.
Why Channel Results Aren't Interchangeable
Search campaigns can capture people who already want the service or product. Prospecting campaigns may introduce a business to people who weren't actively shopping. Comparing their immediate returns without considering those different jobs can lead you to cut the campaigns that bring in future customers.
Brand search deserves particular attention. Someone searching for your company may already intend to buy, so a strong branded result doesn't automatically demonstrate successful new-customer acquisition.
Likewise, paid social can produce a lower immediate ratio while introducing customers who later return through another route. That isn't permission to ignore poor results. It's a reason to evaluate the campaign's role alongside customer acquisition and payback.
How to Compare Like With Like
The reporting definition matters as much as the channel. Google's conversion-value guidance defines conversion value per cost as total conversion value divided by total cost. Switching the numerator from gross sales to net sales or margin changes the reported result without requiring any change in the ads.
The scale of advertising doesn't make an industry benchmark more suitable for your business, either. Triple Whale reports that global digital advertising spending exceeded $1 trillion in 2024, increasing 9.5% from 2023.
Use the row closest to your business model as context, not a verdict. Then examine your margin, customer mix, and reporting definitions before deciding whether your result is strong enough.
Why a Strong ROAS Can Still Lose Money
A 4:1 ROAS looks healthy on a dashboard. Whether it makes money depends on a number the dashboard does not show: how much of each revenue dollar survives as contribution.
Contribution margin means the share of revenue left after variable costs, before advertising in this calculation. That remainder is the only pool available to pay for the ads themselves, then overhead, then profit. A product with a 20% contribution margin needs 5:1 just to cover its media bill, so the same 4:1 result that delights one business loses money for another.

How to Calculate Your Margin Floor
Simplified break-even revenue ROAS = 1 ÷ contribution margin expressed as a decimal.
The following values are arithmetic examples, not industry benchmarks.
Break-even Revenue ROAS by Contribution Margin
| Contribution margin | Break-even ROAS | As a percentage | Reading |
|---|---|---|---|
| 20% | 5.0 | 500% | Needs $5 of revenue per $1 of ads |
| 30% | About 3.33 | About 333% | Needs about $3.33 per $1 |
| 40% | 2.5 | 250% | Needs $2.50 per $1 |
| 50% | 2.0 | 200% | Needs $2 per $1 |
| 60% | About 1.67 | About 167% | Needs about $1.67 per $1 |
Margin sets the floor.
When several product lines carry different margins, weight each one by its share of the revenue a campaign generates. An even split between a 30% line and a 60% line produces a 45% blended margin and a floor near 2.2. If the ads mostly sell your thinnest-margin products, the floor drifts toward that weak line's number, and the blended figure in your reports can flatter the true requirement.
Include returns, discounts, fulfillment, and payment fees when establishing contribution margin. Agency fees and software costs also need funding; count them once rather than omitting them or charging them twice.
Our explanation of how ROAS differs from ROI separates campaign reporting from the broader financial result.
When a Lower Ratio Can Be the Better Buy
Keep these measures distinct:
- ROAS measures attributed revenue per advertising dollar.
- CPA measures the cost per acquired action, which might be a lead or customer. Fully loaded customer acquisition cost includes the wider acquisition expense.
- Lifetime value measures customer value over time. For budget decisions, focus on the contribution that customer can generate, not just future sales.
A hypothetical campaign at 2:1 ROAS may be worthwhile when repeat purchases reliably repay an initially thin return. Another at 8:1 may be a poor growth investment if it mostly captures existing branded demand while new-customer acquisition stalls.
A lower ratio can be the better growth choice, but only when customer economics justify the trade.
Platform credit isn't proof that advertising caused the purchase. The IAB's Measurement 360 whitepaper identifies incrementality, the value caused beyond the no-advertising baseline, as the gold standard and ranks randomized experiments as the strongest causal method.
Compare platform results with cohort profit. Before scaling substantially, run a controlled geographic, audience, or conversion-lift test. Scale when the relevant margin floor is covered and acquired customers are worth more than their fully loaded cost.
Worked ROAS Examples for Sales and Leads
A ROAS can be arithmetically correct and commercially wrong at the same time. These hypothetical campaigns keep the math simple so the differences in interpretation stay visible: what counts as revenue, and whether the margin underneath can carry the spend.
Ecommerce Revenue That Misses the Margin Floor
An ecommerce business spends $8,000, receives 250 completed orders, and holds an $80 average order value.
Its calculation is:
- Attributed revenue: 250 × $80 = $20,000.
- ROAS: $20,000 ÷ $8,000 = 2.5, or 250%.
- Contribution before advertising: $20,000 × 30% = $6,000.
The earlier margin-floor example showed this same ratio clearing the line at a 40% contribution margin. This retailer runs thinner, so contribution covers only $6,000 of the $8,000 media bill, a $2,000 loss before any other fees or profit.
An unaccounted 10% discount widens that loss. If product and fulfillment costs stay fixed while customers pay less, revenue falls to $18,000 and contribution to $4,000, half the media bill. Returns create the same problem when a dashboard keeps reporting original order values instead of adjusted revenue.
Lead Generation With Two Different Answers
A service firm invests $6,000 and receives 40 qualified leads, a cost per qualified lead of $150.
If 10 leads close at $2,000 each, closed revenue is $20,000 and closed-sale ROAS is approximately 3.33. Media-only cost per acquired customer is $600, four times the cost per lead, because only a quarter of the leads became customers.
If the team instead assigns a guessed $200 value to every lead, reported conversion value becomes $8,000, producing approximately 1.33 ROAS.
Only the value definition moved, and it cut the reported ratio by more than half.
Worked Campaigns Compared
| Campaign | Spend | Value counted | ROAS | Verdict |
|---|---|---|---|---|
| Ecommerce, completed order revenue | $8,000 | $20,000 | 2.5 | Loses $2,000 at a 30% contribution margin |
| Lead gen, closed-sale revenue | $6,000 | $20,000 | About 3.33 | Evaluate job margin and customer acquisition cost |
| Lead gen, guessed $200 per lead | $6,000 | $8,000 | About 1.33 | Identical campaign, guessed value |
A PPC lead-generation process that tracks inquiries through qualification and closing keeps those estimates honest. Estimated lead values can support bidding, but label them as estimates and reconcile them against actual closed sales.
How a Blended Account Can Mislead
A brand campaign achieves 6:1 while prospecting achieves 1.8:1. At $5,000 of spending on each, attributed value totals $30,000 plus $9,000, so the account reports 3.9:1 on $10,000, even while new-customer growth is stalling.
The blend reads like a report-card average: one strong subject hides the weak one.
Calculate combined ROAS from total attributed value divided by total spend. Average campaign ratios only when spending is equal.
For each campaign, record spend, value definition, ROAS, margin, CPA, and repeat-purchase potential. Choose gross sales, net sales, or closed revenue deliberately, and keep the definition consistent.
How Target ROAS Bidding Changes Spend
Target ROAS turns the metric from a score into an instruction. In automated bidding, the number you set is the average conversion value you want back per dollar spent: 500% seeks $5 per $1, while 300% seeks $3 per $1. The percentage calculation is $5 ÷ $1 × 100 = 500%.

Why Raising the Target Can Reduce Volume
Target ROAS bidding weighs predicted conversion value alongside the probability that someone converts. A less likely, higher-value order can outbid a likely, low-value one, which is how the system spends toward the number you set.
The target is an average goal; individual results will vary. Some clicks, orders, and days will land far above or below it.
Raising the target makes the system pickier. It bids only where predicted returns clear a higher bar, so auction participation shrinks and spend can fall. Lowering the target permits more reach and spending at thinner revenue efficiency. Either direction can still lose money, because the target controls selectivity, not margin.
Budget guardrail: Don't confuse a higher bidding target with a stronger business result. Check what happened to customer volume and total contribution.
How to Set a Target You Can Defend
Anchor the initial target to your recent conversion-value-per-cost history rather than the return you'd like to see. Google Ads' target ROAS guidance recommends considering historical performance, including the previous four weeks, while accounting for conversion delays.
Complete these setup checks before relying on automated value bidding:
- Accurate values: Confirm currency, transaction amounts, and duplicate handling. A bidding system can't correct a faulty revenue feed.
- Meaningful outcomes: Track purchases or qualified outcomes that connect to actual business value, rather than rewarding every form submission equally.
- Financial alignment: Choose a target that fits your margin, acquisition budget, and growth objective.
When protecting first-order profitability, set the target at or above your break-even floor with room for additional costs, then watch realized contribution to confirm the average is holding.
Accepting a lower first-order target can be the better growth choice, but only when conservative lifetime-value evidence supports the gap and the business can fund the payback period. More customers aren't helpful if you run out of cash before their repeat purchases arrive.
How to Improve ROAS Without Cutting Growth
In 2025, ROAS was the most commonly used metric for measuring marketing spend among more than 200 marketing leaders surveyed by Marketing Brew and Tatari. That reliance raises the cost of a sloppy value setup. One mis-set conversion value can push an entire account to bid aggressively on low-value form fills while every report insists performance looks fine.
Judge campaigns on high-intent revenue, and use clicks and impressions only to diagnose delivery and creative performance. Those numbers work like a speedometer: they show movement, but say nothing about whether the trip was worth the fuel. A campaign can produce cheap traffic all quarter and still attract customers who contribute little.

How to Run a Revenue-First Improvement Cycle
Standardize conversion value. Keep one consistent primary value definition across the account. Document exceptions explicitly, so a reporting change doesn't masquerade as an advertising improvement.
Match reporting to the sales cycle. A long-consideration service lead can't be judged by a single day's sales. Review mature lead cohorts and let closed revenue arrive before declaring the acquisition unsuccessful.
Separate brand, remarketing, and prospecting. Give each a clear reporting line, so strong existing-customer demand doesn't hide weak new-customer economics.
Weigh customer cost against contribution. Price each acquisition against first-order contribution, with only a cautious allowance for repeat purchases. A new customer bought above that line makes sense only when the gap closes inside a payback period the business can finance.
Fix post-click problems before raising bids. Check that the offer is clear, the page loads properly on mobile, and the sales team responds promptly. Test forms and booking flows yourself, then inspect whether qualified inquiries receive useful follow-up.
Change one major variable at a time. Hold a suitable control group and judge results across a full buying cycle. Adjusting targeting, creative, landing pages, and bidding together leaves no way to tell what helped.
Prove extra revenue before scaling spend. Run a controlled incrementality test to separate additional business from sales that merely received advertising credit. A favorable last-click report alone isn't enough.
What to Review Each Week
Build the review around spend, ROAS against the margin floor, CPA, and the share of revenue from new customers. Add notes on conversion delays, returns, and offer changes, so the team interprets movement instead of reacting to it.
Use contribution margin analysis to see which products or services can support acquisition. An account-wide gain can still conceal a shift toward less profitable orders.
A falling ratio calls for diagnosis before cuts. The cause may be measurement, a weaker customer mix, or follow-up rather than the auction. A rising ratio deserves the same scrutiny, because trimming prospecting can polish the dashboard while shrinking the future customer base.
Set the ROAS Target Your Margin Can Support
A target is useful only when it fits the economics of the customers you want to acquire. Before setting one, make sure the measurement is consistent, the revenue definition and spend are clear, and reporting uses compatible dates and attribution rules. Then judge brand activity separately from prospecting, so existing demand is not mistaken for growth from new customers.
Use your own contribution margin to set the media-cost floor. The break-even ROAS calculation shows how that floor changes with the share of revenue left after variable costs. Set an operating target above break-even to account for other costs and the profit you want to retain. A lower first-order return may still fit if conservative lifetime value supports the payback and the business can afford to wait for it.
For a local service firm, work backward from closed-job value and delivery margin, not a guessed inquiry value. Lead volume alone cannot establish whether acquisition is sustainable.
Apply the target to your business
- Check the margin: Use the contribution margin for the specific product or service being advertised.
- Set a floor and target: Establish the media-cost break-even point, then allow room for additional costs and desired profit.
- Test payback assumptions: If relying on repeat purchases or future revenue, document the expected payback and confirm it is affordable.
- Review conversion values: For lead campaigns, base value on closed work and its delivery margin rather than raw inquiries.
The next step may be a review of conversion values, customer costs, or the sales process. Improving lead handling or follow-up can change the value of the same advertising spend.
The Advertising Suite consolidates marketing services under one roof. Its Ad Suite Membership includes access to the in-house CRM and Review Management Software tools, which can support the customer experience after an ad generates a lead.