Most advertisers don't have a ROAS problem, they have a profitability problem hiding inside a ROAS number. A dashboard can look healthy while margins, fulfillment, and attribution leakage eat the return, which is why a clean-looking platform metric can still send you backward. If you've ever stared at a strong ratio and still felt uneasy, that skepticism is usually justified.
The key question in how to calculate return on ad spend isn't whether the math is simple. It's whether the inputs are honest. ROAS is built to measure ad efficiency, but only if you define revenue, cost, and attribution with enough discipline to keep the number from flattering the wrong decision.
Why Platform-Reported ROAS Is Lying to You
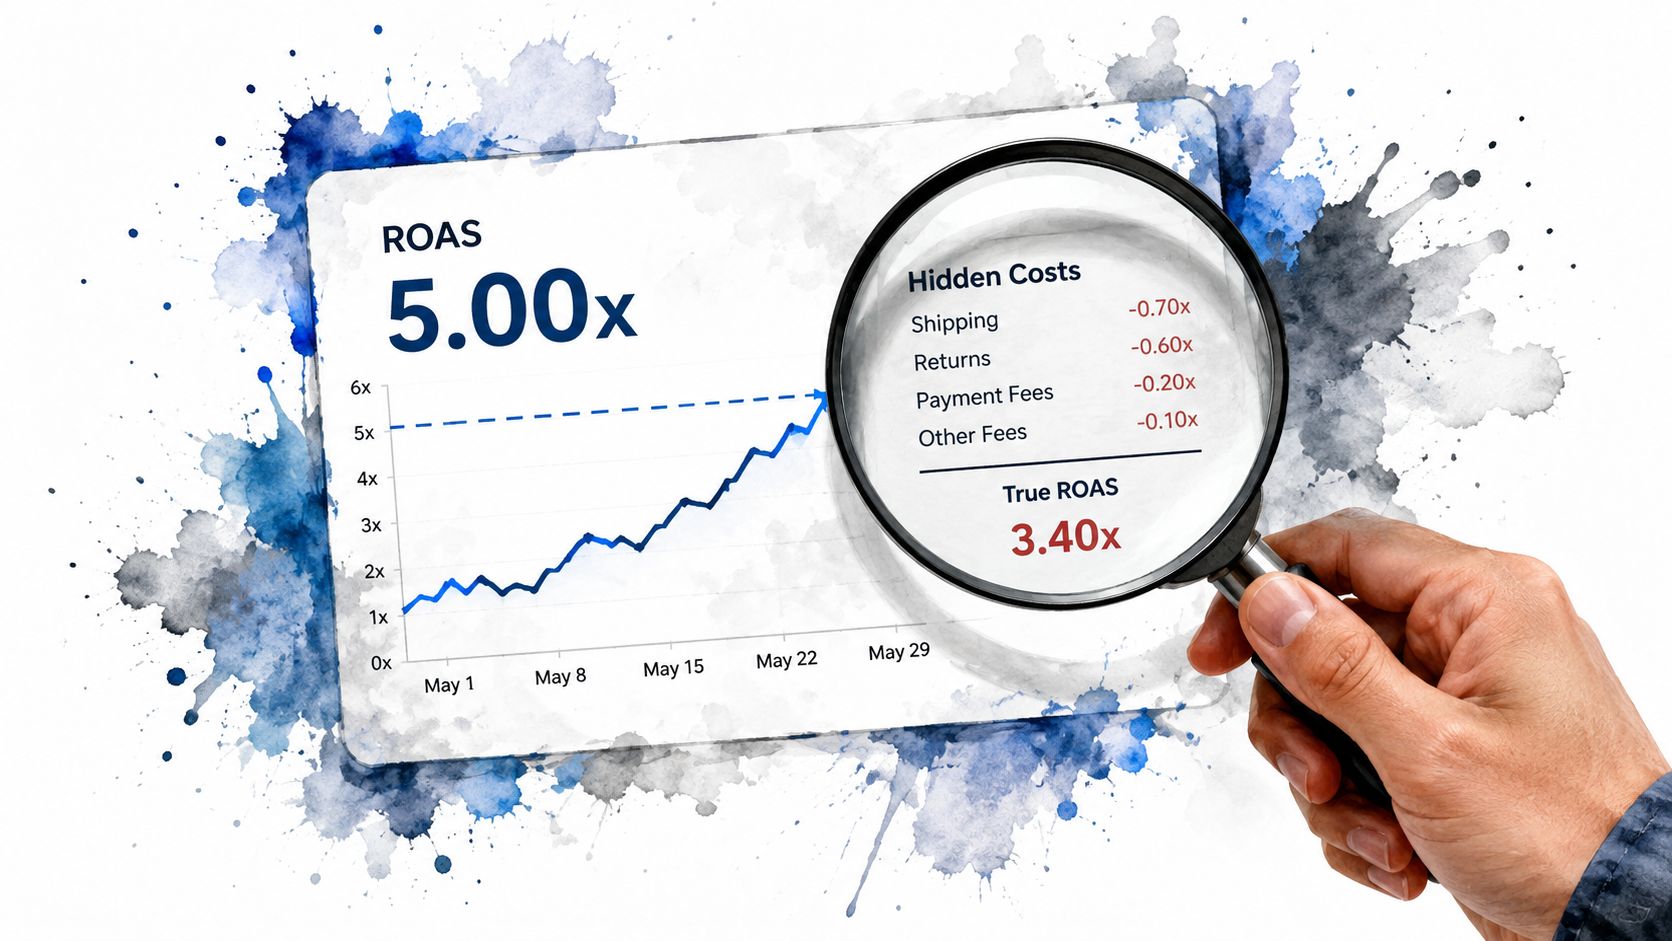
A platform-reported ROAS figure feels decisive because it gives you one clean number and a false sense of certainty. The problem is that the dashboard usually sees only the ad system's own view of the world. It does not automatically know your product margin, shipping burden, labor, or whether another channel already claimed the same sale.
What the dashboard can't see
ROAS is defined as revenue attributed to advertising divided by advertising spend. That's the right starting point, and it's why many sources express it as 3.0x or 300% when a $1,000 spend produces $3,000 in revenue, which is the same as saying every $1 of ad spend produced $3 in revenue. A break-even point of 100%, or 1.0x, means the campaign matched spend but didn't yet produce positive gross return from ads alone, according to the standard ROAS framing in Wall Street Prep's ROAS overview.
That's useful, but it's not the whole story. A campaign can clear the ROAS threshold and still lose money once the business pays for product, shipping, service delivery, or labor. That's the gap most “good ROAS” conversations skip, and it's the reason margin-aware analysis matters more than applause from a dashboard.
Practical rule: if you can't explain what the ROAS number excludes, you don't really know what it means.
Why skepticism is healthy
The agency-burned founder is usually reacting to a real failure mode, not paranoia. Platform-native ROAS can overstate performance when attribution is incomplete, when campaigns overlap, or when multiple channels influence the same purchase. Guidance on profitability-adjusted ROAS calls out this exact blind spot, noting that a strong-looking number can still hide losses once direct costs are included, especially when teams stop at the ad platform's revenue view. That concern is captured well in CDP's ROAS glossary.
The fix is not to throw ROAS out. It's to treat it like a diagnostic, not a verdict. If a campaign looks great but cash flow feels tight, the number probably isn't lying, it's just incomplete. The rest of this guide is about making the number tell the truth.
The dashboard conversation gets much clearer when you anchor it in a real reporting system, because a dashboard without cost discipline is just a prettier way to guess.
The Core ROAS Formula and Worked Examples
The core formula is straightforward, and that is exactly why it gets misread. ROAS = attributed revenue ÷ ad spend. Spend less and bring in more attributed revenue, and the ratio rises. Spend more without a matching lift in attributed revenue, and it falls.
A clean calculation starts with clean inputs.
Use one unit consistently across every scenario, then keep the output format fixed. Some teams prefer a ratio, others prefer a percentage, but the choice should stay consistent so benchmarks do not drift over time. The ratio and percentage are just two ways to express the same result, so 2.0x equals 200%, and 1.0x equals 100%.
| Scenario | Ad Spend | Attributed Revenue | ROAS (Ratio) | ROAS (%) |
|---|---|---|---|---|
| Single ad | $1,000 | $3,000 | 3.0x | 300% |
| Campaign with multiple creatives | $2,000 | $4,000 | 2.0x | 200% |
| Aggregated multi-channel rollup | $5,000 | $15,000 | 3.0x | 300% |
The standard ratio form is the same structure described in Wall Street Prep, revenue divided by spend, then expressed as a multiple or percentage. The middle example mirrors the kind of calculation shown in Goodway Group's ROAS guide, where $2,000 in spend and $4,000 in revenue gives 200% ROAS, or 2:1. The third example is the one that matters most in real accounts, because leadership cares about the outcome of the whole system, not whether revenue came from one ad or several channels.
How to compute it without fooling yourself
Single-ad math is useful for creative tests. Campaign-level rollups are better for checking audience and offer fit. An aggregated number is what you want when finance asks for one answer for the quarter.
The formula stays the same, but the inputs have to be consistent. If you mix gross revenue from one channel with net revenue from another, or if you leave agency work and creative production out of spend, the ratio stops being comparable. That is why discipline in the inputs matters more than polished formatting.
Use a structured ROI framework when you want the revenue math to survive finance review, because loose definitions are where persuasive spreadsheets turn into bad decisions.
Gross vs Net ROAS and Break-Even Thresholds
Gross ROAS shows how much attributed revenue an ad produced for each dollar spent. Net ROAS asks a harder question, how much is left after direct costs are taken out. Those are different numbers, and treating them as interchangeable is how campaigns look healthy in a dashboard while losing money in the business.

Gross ROAS is the top line view
Gross ROAS uses attributed revenue divided by advertising cost. That makes it useful for comparing campaigns inside the same channel, because it keeps the focus on ad efficiency. It also makes gross ROAS easy to overread, since the metric says nothing about what remains after fulfillment, payment processing, refunds, or any other direct business cost.
Break-even is the number that matters. A business with tight margin can need a much stronger ROAS than a business with more room in the unit economics, even if both campaigns show the same multiple. A 4x platform-reported ROAS can still be a losing trade once margin, fulfillment, and other direct costs are included.
Net ROAS is where profitability lives
Net ROAS subtracts direct costs before dividing by ad spend. In plain terms, you stop asking how much revenue the campaign produced and start asking how much value remained after the costs of delivering that revenue were paid. That is the difference between a campaign that scales and one that only looks good on paper.
A better threshold comes from margin math, not media optimism. Use contribution margin analysis to set the floor, because it forces the ad number to match what the business keeps after variable costs. That approach is more honest than relying on gross revenue alone, especially when labor, landing page work, and other operating costs sit outside the platform invoice.
A campaign does not become profitable because the dashboard says it is. It becomes profitable when the cash left after direct costs is real enough to cover the rest of the business.
Attribution Windows and Multi-Channel Measurement
The hardest ROAS mistake isn't bad arithmetic. It's deciding which revenue deserves credit when multiple platforms all want the same conversion. Once you work across search, social, email, and retargeting, the clean single-channel answer disappears fast.

Why attribution changes the number
ROAS only means something if the attribution window is defined consistently. Different windows can make the same campaign look stronger or weaker depending on whether the conversion happened quickly or after multiple touches. Last-click reporting also tends to undervalue upper-funnel activity, because it credits the final interaction while ignoring the earlier clicks that created the demand.
Modern measurement needs a multi-system workflow. Export spend and conversion data from ad platforms, join it to analytics sessions through UTM parameters or click IDs, then tie closed revenue back through CRM or finance records using identifiers like email, company domain, opportunity ID, and revenue value. That workflow is outlined in Leadscale's ROAS formula guide, and it's the difference between campaign vanity and defensible reporting.
Why privacy made this harder
Post-2020 privacy changes reduced signal quality, so platform-native ROAS is less reliable than it used to be. That doesn't mean measurement is broken, it means the burden moved from the ad platform to the operator. You need unified tracking, reconciliation checks, and a clearer definition of what counts as attributed revenue.
HubSpot's ROAS glossary points to the practical reality here, multi-touch attribution and cross-platform tracking matter because one conversion can be claimed by more than one platform. That's why a weighted attribution approach is usually more defensible than accepting whichever channel shouts loudest.
If the same sale appears in three dashboards, only one of them is telling the truth. The others are telling a version of the truth that helps them optimize themselves.
This is where a proper attribution model stops the argument from becoming a spreadsheet war, because the point is to make one number finance can trust.
Common ROAS Mistakes and How to Fix Them
The expensive mistakes are usually boring. They come from bad defaults, vague definitions, or dashboards that were never built to answer profitability questions. The fix is rarely clever, it's usually disciplined.
The symptom and the fix
- Double-counted revenue: The dashboard shows multiple channels winning on the same sale. The root cause is platform overlap and loose attribution. The fix is to reconcile closed revenue in one source of truth before calculating ROAS.
- Wrong attribution window: Short-window campaigns appear to underperform, or long-window campaigns look inflated. The root cause is a mismatch between the buying cycle and the window being used. The fix is to align the reporting window with the actual sales cycle and keep it consistent.
- Ignoring lifetime value: Subscription and repeat-purchase businesses treat first-order revenue as the full picture. The root cause is a narrow view of customer economics. The fix is to separate first-order ROAS from longer-horizon value, then decide which one should drive budget decisions.
- Treating ROAS as standalone: A campaign looks excellent in a platform, but margin pressure keeps rising. The root cause is that the number is being used without cost context. The fix is to compare gross and net views together instead of trusting one line in isolation.
What usually happens in the wild
In audited accounts, the worst pattern is often not a low ROAS number. It's a decent-looking number paired with weak gross profit. The team keeps scaling because the ad platform says the campaign is efficient, while finance wonders why cash isn't improving. That tension usually means the wrong revenue is being counted, or the denominator is too shallow.
The cleanest self-check is simple. If your ROAS looks better every month but the business feels worse, your measurement is rewarding the wrong layer of the funnel. If your leadership team can't answer which costs are included, the number isn't ready for budget decisions.
If the metric can't survive a margin conversation, it's not a performance metric yet. It's just a reporting habit.
Your ROAS Calculation Template and Tool Stack
A defensible ROAS process starts with a spreadsheet that finance can audit without a translator. Build columns for campaign ID, platform, spend, attributed revenue, direct costs, gross ROAS, net ROAS, and a break-even comparison. That structure keeps the discussion grounded in math instead of opinions.
What the workflow needs
Use a simple monthly rhythm. Pull platform spend, match it to campaign IDs, and reconcile those IDs against analytics and CRM records before you calculate the ratio. If a campaign ID doesn't map cleanly to an ad, or a conversion doesn't map cleanly to an account, stop and fix that gap before you publish the number.
A practical stack usually needs three things, even if the exact tools vary by business:
- Closed-loop revenue tracking: So sales outcomes flow back into media reporting instead of living in a separate file.
- Consistent UTM tagging: So traffic and conversion data can be joined reliably across systems.
- Reconciliation checks: So every campaign ID maps to an ad and every conversion maps to an account before ROAS is finalized.
What to review each month
Compare platform-reported ROAS against your own calculated version. If they differ, don't average them and move on. Investigate whether the gap came from attribution windows, duplicate claims, excluded costs, or missing closed revenue.
The right marketing technology stack is the one that makes this monthly review boring, because boring measurement is usually good measurement. The point isn't to collect more dashboards. It's to make sure the number you trust is the one protecting margin, not just celebrating clicks.
If you want a partner that treats ROAS as a profitability check, not a vanity badge, The Advertising Suite builds the tracking, CRM, and campaign discipline that keeps ad spend tied to real revenue. Book a growth consult and let their team plug the measurement leaks so your marketing starts reporting like a business, not a guessing contest.