Most advice about dashboards is too polite.
It says a marketing dashboard is a place to “see your data in one view,” as if the hard part is arranging charts. It isn't. The hard part is making sure the dashboard tells the truth about revenue. If it only shows traffic, clicks, leads, and platform-reported return, it's not a decision tool. It's a prettier spreadsheet with better lighting.
That's why the question isn't just what is a marketing dashboard. The better question is whether your dashboard helps you invest in profitable growth or distracts you with activity that looks impressive in a meeting.
Why Your Marketing Dashboard Is Probably Lying to You
A lot of businesses think they have a dashboard problem when they really have a trust problem. The report exists. People open it. Then they go right back to manual analysis because the numbers don't answer the question that matters most: what's driving revenue, and what should we change next?
That pattern is widespread. 72% of regular dashboard users still export data to Excel to perform analysis manually, and BI tools have an overall adoption rate of only 20%, according to marketing dashboard best practices research. If people keep leaving the dashboard, it usually means the dashboard isn't useful enough to run the business.
The usual failure looks familiar:
- Too many charts: Teams pack everything into one screen and call it “complete.”
- Too little context: Spend is visible, but sales quality isn't.
- Too much platform logic: The dashboard reflects what the ad account wants to report, not what the business needs to know.
A founder who's been burned by agencies has seen this movie before. The report highlights impressions, click-through rates, and cost trends. Everyone sounds busy. Nobody can say which campaigns produced profitable customers.
Practical rule: If your dashboard can't explain the gap between lead volume and closed revenue, it's not an operating tool.
The deeper issue is fragmentation. Marketing data lives in one place. Sales outcomes live somewhere else. Customer history lives somewhere else again. Without unified customer profiles, the dashboard can only describe the front half of the journey.
That's why dashboards “lie” even when the charts are technically accurate. They report partial truth. In growth work, partial truth is expensive.
The Command Center Versus The Vanity Mirror
A real dashboard should behave like a command center. Most act like a vanity mirror.
The difference matters. A command center helps a team steer. A vanity mirror helps a team admire movement that may have nothing to do with profit. One drives decisions. The other flatters activity.

What a marketing dashboard actually is
A marketing dashboard is a consolidated workspace that pulls real-time data from multiple sources into one view so a team can see performance and respond quickly. The category is growing because businesses need fewer disconnected reports and more usable decision systems. The global marketing dashboard market was valued at approximately USD 1.2 billion in 2024 and is projected to reach USD 2.5 billion by 2032, according to this marketing dashboards market analysis.
That definition sounds simple. In practice, a useful dashboard does three jobs at once:
- It centralizes inputs from ad channels, site analytics, CRM records, email activity, and social performance.
- It adds business context so a raw number becomes a KPI tied to a goal.
- It connects performance to action so a team knows whether to cut spend, shift budget, fix follow-up, or scale a campaign.
A dashboard that only completes the first job isn't finished.
The vanity mirror version
A vanity dashboard usually looks polished. It might include colorful trend lines, campaign summaries, and weekly scorecards. The problem is that it answers questions nobody would bet money on.
Common vanity-mirror signals include:
- Surface metrics first: impressions, followers, and traffic dominate the screen
- No financial layer: revenue quality, margin, and sales outcomes are missing
- No next action: the team can observe the problem but can't tell what to do next
The right dashboard should help a founder answer one question quickly: is our marketing investment producing profitable growth?
That's the standard. Not whether a campaign generated attention. Not whether cost per click looked efficient in isolation. Whether the business is turning demand into cash.
The command center version
A command-center dashboard is narrower and sharper. It doesn't try to be a museum of every metric your team can export. It's built to support decisions inside a specific operating rhythm.
That's where data-driven marketing solutions matter. The value isn't in “seeing more data.” The value is in seeing the right data in the right order.
A practical command-center dashboard usually surfaces:
- Acquisition reality: what it costs to generate qualified demand
- Pipeline movement: what happens after a lead arrives
- Revenue outcome: which efforts convert into actual business value
If the dashboard can't link those three, it may look modern, but it won't help you scale responsibly.
What Revenue-Focused KPIs Should You Actually Track
Many teams don't need more metrics. They need better priorities.
When dashboards focus on actionable KPIs such as cost per acquisition instead of vanity metrics such as impressions, they correlate to a 20-30% increase in actionable optimization opportunities, based on this dashboard benchmarking write-up. That's the difference between staring at charts and improving performance.
The cleanest way to decide what belongs on a dashboard is the rule of three. Track metrics across acquisition, customer value, and profitability.
Acquisition tells you if demand is efficient
Many teams stop too early. They monitor lead flow and celebrate volume, but volume without qualification creates fake confidence.
Useful acquisition KPIs include:
- Customer acquisition cost: what you spend to acquire a customer, not just a click or form fill
- Cost per lead: useful when lead quality is stable and sales follow-up is consistent
- Conversion rate by channel: which traffic sources produce action, not just visits
These metrics help answer whether demand generation is getting more efficient or just getting louder.
Customer value tells you what the lead was worth
A cheap acquisition number can hide a weak business outcome. Some channels produce customers who buy once, churn fast, or require too much service overhead. A strong dashboard should expose that.
Look for indicators such as:
- Lifetime value
- Pipeline contribution
- Repeat purchase or retention trends
- Lead-to-opportunity and opportunity-to-sale progression
In this context, a lot of “winning” campaigns start to look less heroic.
A channel can look efficient in the ad account and still produce weak customers. Revenue-focused teams judge acquisition by downstream value.
Profitability tells you whether growth is worth funding
This is the layer too many dashboards avoid because it forces hard conversations. Profitability metrics remove the comfort blanket from media reporting.
At minimum, decision-makers should be able to inspect:
- Return on ad spend
- Contribution margin
- Revenue by campaign or channel
- Budget pacing against target outcomes
A business can grow top-line revenue and still make poor marketing decisions if margin erodes. That's why contribution margin analysis belongs in the conversation.
Revenue-First KPIs vs. Vanity Metrics
| Metric Type | KPI Example | What It Tells You |
|---|---|---|
| Revenue-First KPI | Customer Acquisition Cost | Whether growth is becoming more or less expensive |
| Revenue-First KPI | Return on Ad Spend | Whether media investment is producing enough return to justify spend |
| Revenue-First KPI | Pipeline Contribution | Which campaigns influence real sales movement |
| Revenue-First KPI | Lifetime Value | Which customer sources create stronger long-term revenue |
| Vanity Metric | Impressions | How often content or ads were shown |
| Vanity Metric | Follower Count | Audience size, not business impact |
| Vanity Metric | Raw Click Volume | Interest at the top of the funnel without downstream quality |
The rule is simple. Keep a metric if it changes a budget, targeting, offer, or sales decision. Remove it if it only gives the team something to admire.
Choosing Your Dashboard Type Strategic vs Tactical
One dashboard for everyone sounds efficient. In practice, it usually creates confusion.
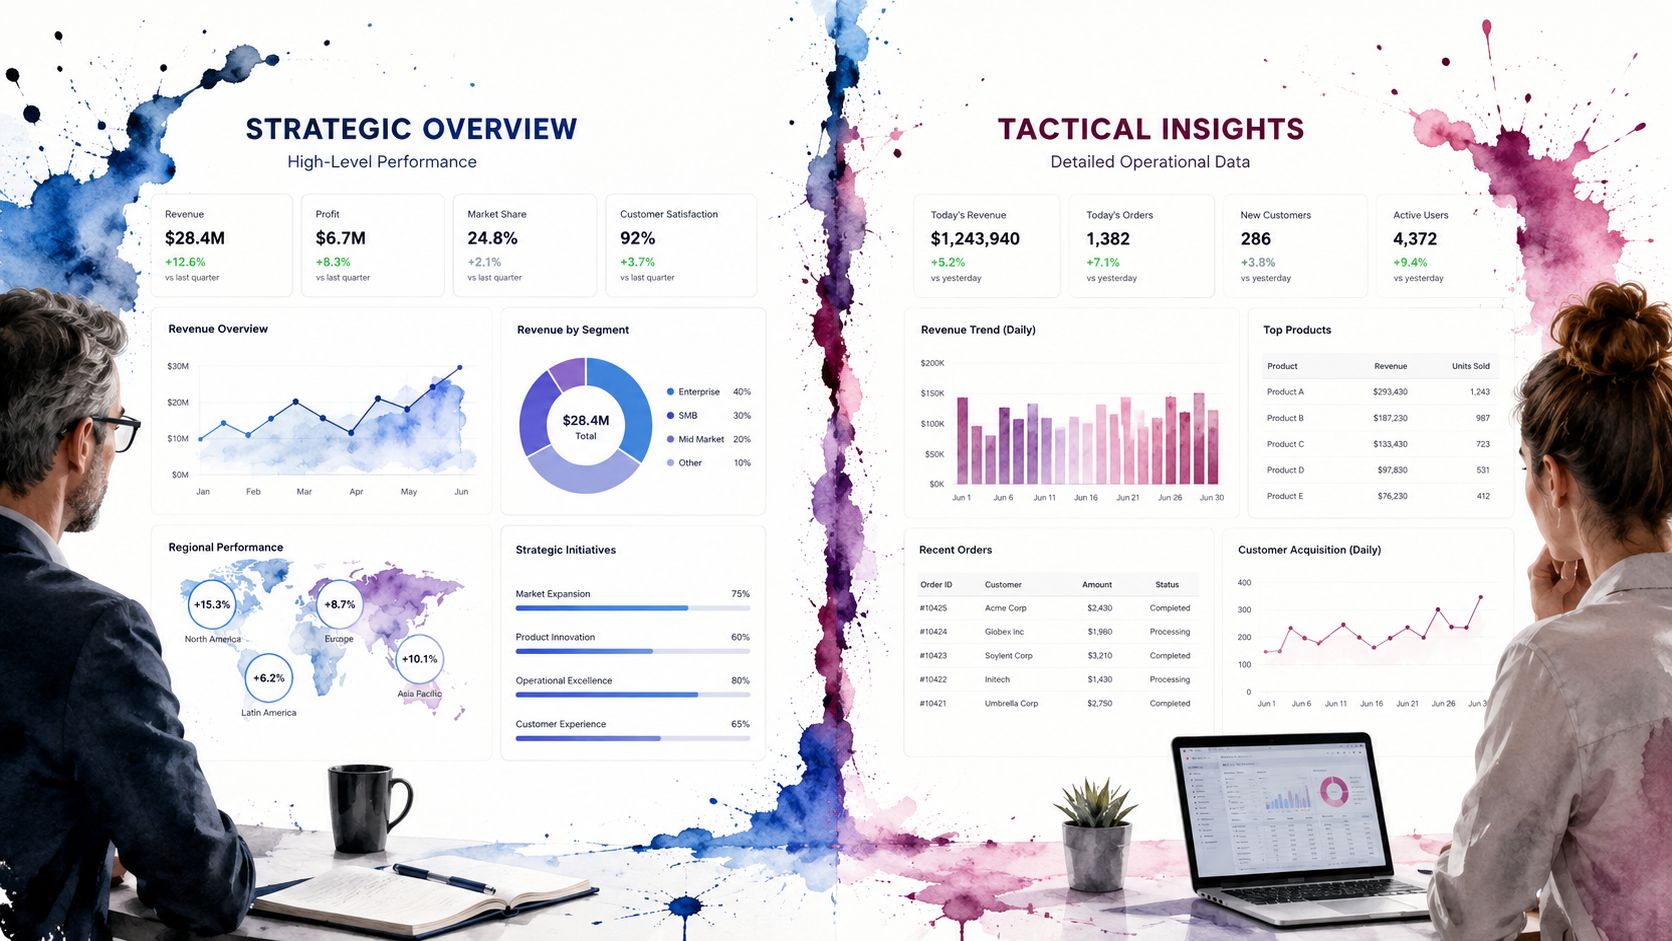
When a single screen tries to handle executive reporting, campaign optimization, and analyst-level investigation, it collapses under its own ambition. A dashboard must serve exactly one clear purpose, either status monitoring, performance analysis, or canned insights. Trying to combine all three makes it ineffective, as explained in this guide to dashboard purpose and usability.
Strategic dashboards for decision-makers
An executive dashboard should be sparse on purpose. Founders and leadership teams don't need a wall of campaign detail. They need a fast read on whether marketing is helping the business grow efficiently.
That usually means a strategic dashboard emphasizes:
- Revenue impact
- Return by major channel
- Budget pacing
- Pipeline health
- Sales conversion trends
If a founder has to scroll to understand performance, the dashboard is already doing too much.
Tactical dashboards for managers
A performance dashboard sits closer to weekly execution. Managers need enough detail to adjust spend, review channel mix, spot underperformance, and pressure-test campaign assumptions.
This version often includes:
- Spend by campaign
- Cost per lead or acquisition
- Conversion rate by channel
- Creative or audience breakdowns
- Short-term trend lines
It's a hub for tactical changes. Pause this campaign. Increase budget there. Fix the landing page. Tighten qualification.
Specialist dashboards for deep work
A channel-specific or analyst dashboard is built for diagnosis. It's narrower than the other two and often more technical. Specialists use it to inspect attribution issues, traffic quality, sequencing problems, and conversion drop-offs.
That's also where multi-touch attribution model thinking becomes useful. The point isn't to make the reporting more complicated. It's to stop making strategic decisions from oversimplified channel credit.
Build fewer dashboards, but give each one a job. A dashboard without a defined user and decision path becomes wallpaper.
A simple decision filter
Before you build or redesign any dashboard, ask three questions:
- Who uses this view?
- What decision should they make from it?
- What information is unnecessary for that decision?
That third question is the one many teams avoid. It's also the one that keeps a dashboard useful.
How to Build a Dashboard That Actually Drives Growth
Most dashboard projects fail before design becomes the issue. They fail in the data model.
A beautiful reporting layer can't rescue broken business logic. If the dashboard doesn't connect media inputs to actual customer outcomes, you're still making decisions in the dark. That's the heart of the Amnesiac Data problem.
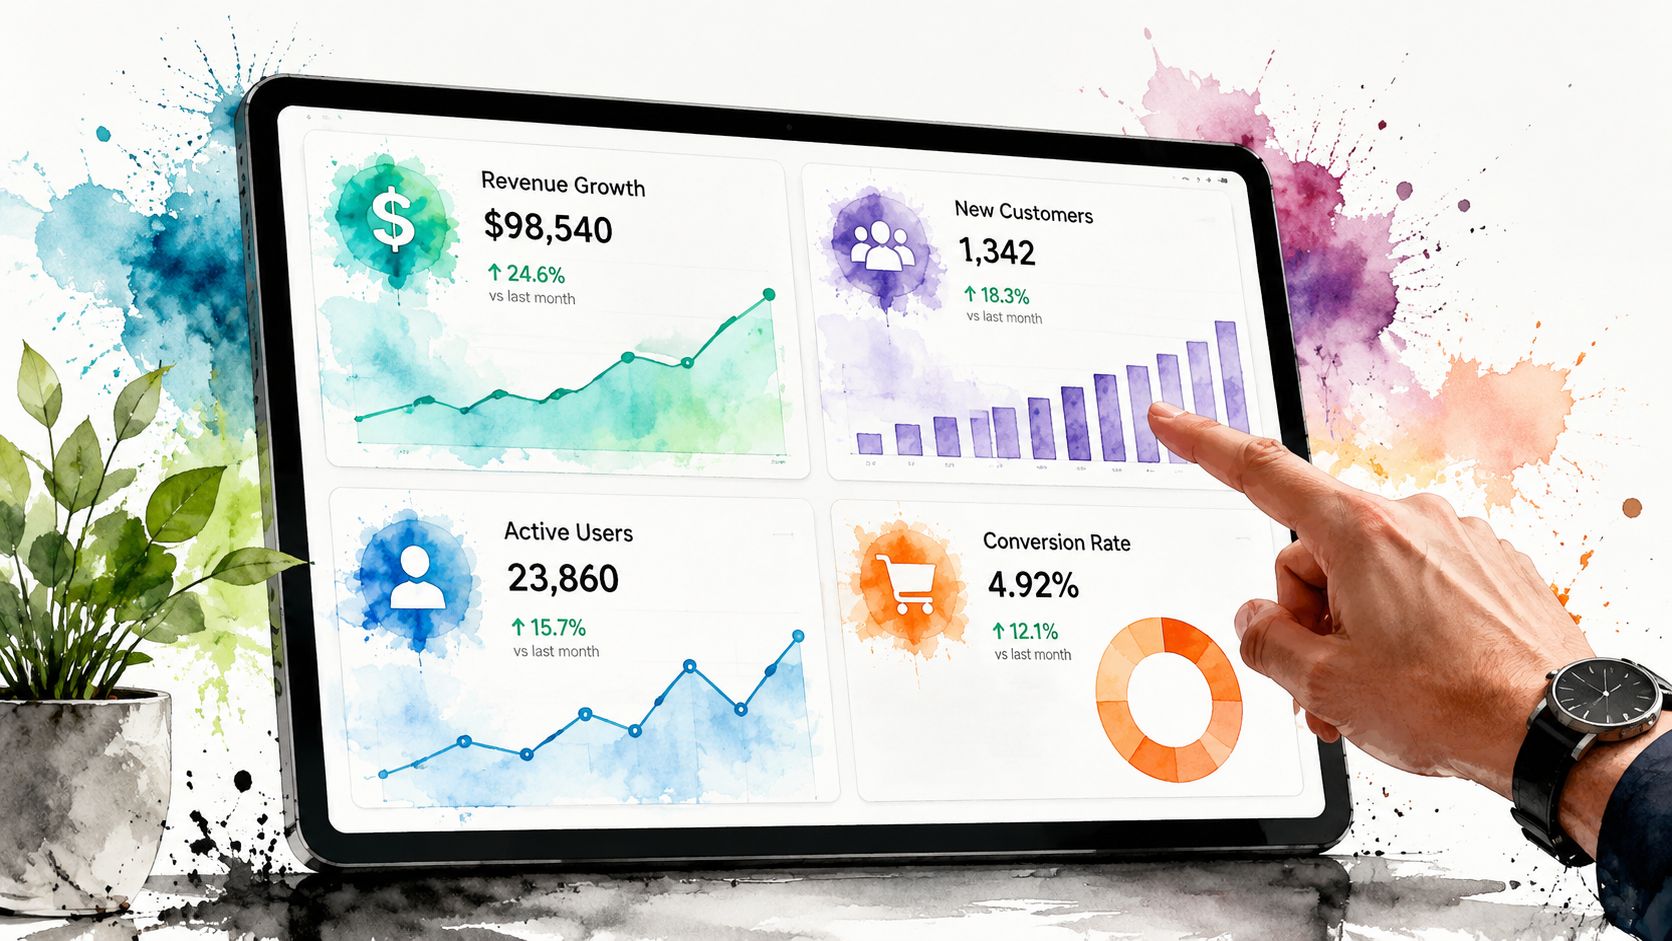
Start with the business question
Don't begin with charts. Begin with a commercial question.
Examples include:
- Which channels produce profitable customers?
- Where are leads stalling between inquiry and close?
- Are rising acquisition costs hurting margin or just shifting timing?
- Which campaigns deserve more budget this month?
That question determines what the dashboard is for. Without that anchor, teams default to reporting what's easy to pull instead of what's useful to act on.
Connect the full set of operating data
A growth-ready dashboard needs more than front-end marketing feeds. It has to combine demand data with sales and customer data. Otherwise, it can't distinguish between cheap leads and valuable customers.
A practical build usually connects these categories:
- Traffic and engagement data
- Campaign spend and conversion data
- Lead and opportunity records
- Closed revenue data
- Customer quality or retention signals
This is why a strong first-party data strategy matters. As external tracking gets less reliable, the quality of your owned business data becomes the difference between reporting activity and understanding performance.
Fix Amnesiac Data before you trust ROAS
Here's the blunt version. Most dashboards remember ad spend better than they remember customer value.
That disconnect has a measurable cost. A critical flaw in most dashboards is “Amnesiac Data,” and 68% of SMBs make optimization decisions based on misleading ROAS because their dashboards don't unify media execution data with profit lifecycle data from a CRM, according to this analysis of dashboard disconnects.
That means the dashboard may tell you a campaign is performing when all it's really doing is generating leads that don't close, low-value customers, or revenue with weak margin.
The fix is structural, not cosmetic:
- Match acquisition records to CRM outcomes so you can see what happened after the click.
- Track stage progression so lead volume doesn't hide sales friction.
- Layer in value and profit signals so return reflects business reality, not platform storytelling.
If your dashboard stops at lead generation, it has amnesia. It forgot the part where the business gets paid.
Design charts that trigger action
Once the data model is right, visualization becomes simpler. Every chart should point toward a decision.
That means:
- Use trend views for pacing problems
- Use comparison views for channel allocation
- Use funnel views for conversion bottlenecks
- Use alerts for threshold changes that need immediate review
A chart earns its place when someone can answer, “What do we do if this moves?”
Assign ownership and review cadence
Dashboards don't fail only because of data. They also fail because nobody owns the operating ritual around them.
A useful dashboard needs:
- One owner who maintains definitions and data quality
- A review rhythm tied to business cadence
- A clear escalation path when performance changes require action
The dashboard isn't the strategy. It's the scoreboard and control panel for the strategy. Build it that way, and it becomes part of how the business grows. Build it as a decoration, and people will keep exporting to spreadsheets.
Real Dashboard Examples for SMBs and E-commerce
The best dashboard setup depends on the business model. An online store and a service franchise don't need the same view because they don't make decisions the same way.
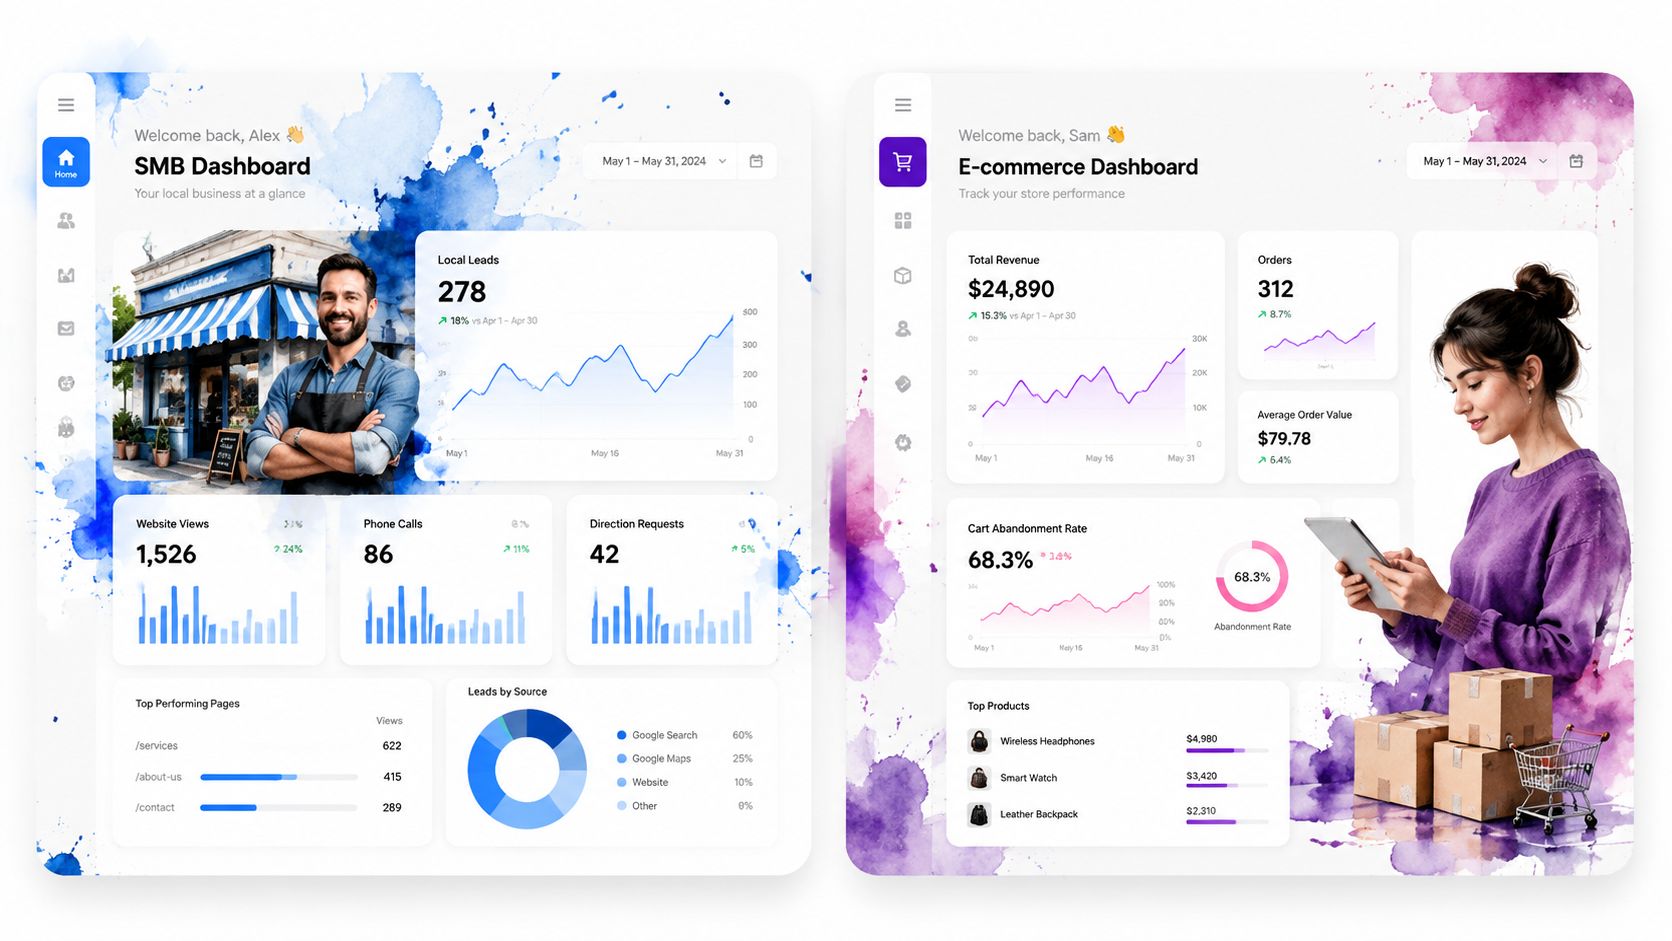
Example one for an e-commerce brand
An e-commerce dashboard should connect traffic, conversion, and customer value without turning into a cluttered merchandising report. The point isn't to watch every product metric at once. The point is to identify where paid demand becomes profitable revenue.
A practical e-commerce dashboard often includes:
- Channel-level return on ad spend
- Customer acquisition cost
- Cart abandonment trend
- Revenue by campaign or offer
- Repeat purchase behavior
- Average order value and margin context
The decisions it supports are direct. Shift spend toward campaigns that bring in stronger customers. Cut budget on ads that create low-value first purchases. Investigate checkout friction if cart activity rises but completed purchases stall.
The mistake here is over-reading top-funnel excitement. A spike in sessions or add-to-cart activity can look encouraging while the checkout experience, product mix, or post-purchase economics tell a very different story.
Example two for a service-based franchise
A local service business needs a dashboard that cares more about booked and qualified demand than raw lead count. If you run a multi-location service operation, a cheap lead that never answers the phone isn't an asset. It's admin work.
A useful service dashboard often tracks:
- Lead source by location
- Cost per booked appointment
- Lead-to-booking conversion
- Booked-to-close progression
- Call handling or response quality indicators
- Review flow and reputation movement
Finally, revenue reporting and customer experience converge. If one location generates leads well but closes poorly, the issue may not be media performance. It may be response time, intake quality, or sales follow-up. If bookings are healthy but review quality slips, that affects future conversion and local trust.
Local service dashboards should connect lead quality, booking quality, and reputation signals. Otherwise, marketing gets blamed for an operations problem.
This is also why reputation management shouldn't sit in a separate reporting universe. For service businesses, reviews influence conversion before a prospect ever calls. A dashboard that ignores that leaves out a major part of demand generation.
Your Dashboard Is a Tool Not a Trophy
A dashboard has no value by itself.
Its value comes from the decisions it drives, the waste it exposes, and the revenue leaks it helps a team fix. If nobody changes budget, targeting, follow-up, offer structure, or customer experience because of what the dashboard shows, it's not a growth asset. It's office art.
The strongest dashboards share three traits:
- They have one job
- They connect marketing data to business outcomes
- They belong to an operating rhythm, not a quarterly presentation
That last point matters. Someone needs to own the numbers, maintain the definitions, and lead the review cadence. Without that discipline, even a solid dashboard degrades into another report people stop trusting.
The bigger lesson is simple. The question “what is a marketing dashboard” has an easy technical answer and a harder commercial one. Technically, it's a system that consolidates performance data. Commercially, it's the instrument panel you use to steer growth. If it can't connect spend to sales truth, it can't do the job.
If you want a dashboard that does more than report activity, The Advertising Suite builds the full revenue system behind it. Strategy, media execution, integrated CRM, and reputation management all work together so your reporting reflects what drives profit. For businesses that want a results-first framework, not another vanity report, Request a Demo or Book a Growth Consult. If you want deeper software access and better economics, Explore the Membership for the 25% discount on all services and access to the proprietary CRM. That's how you turn reporting into action, with a growth-focused partner that operates like an extension of your team.