Most advice on conversion funnels starts at the wrong end. It tells teams to chase more traffic or polish the final button, then acts surprised when revenue barely moves. Conversion funnel analysis works because it shows where intent weakens, where the process leaks, and which stage is killing the sale.
That's the difference between a dashboard and a diagnosis. A top-line conversion rate can hide a broken signup flow, a confusing pricing step, or a form field that sends people away. The more useful question is simple, where do people stop moving forward, and why?
Why Top-Line Conversion Rates Are Lying to You
A single conversion rate is a blunt instrument. It gives you the end result, but it hides the friction between the first click and the final commitment. Stage-level diagnosis is what makes conversion funnel analysis useful, because it shows the exact point where intent starts to fail.
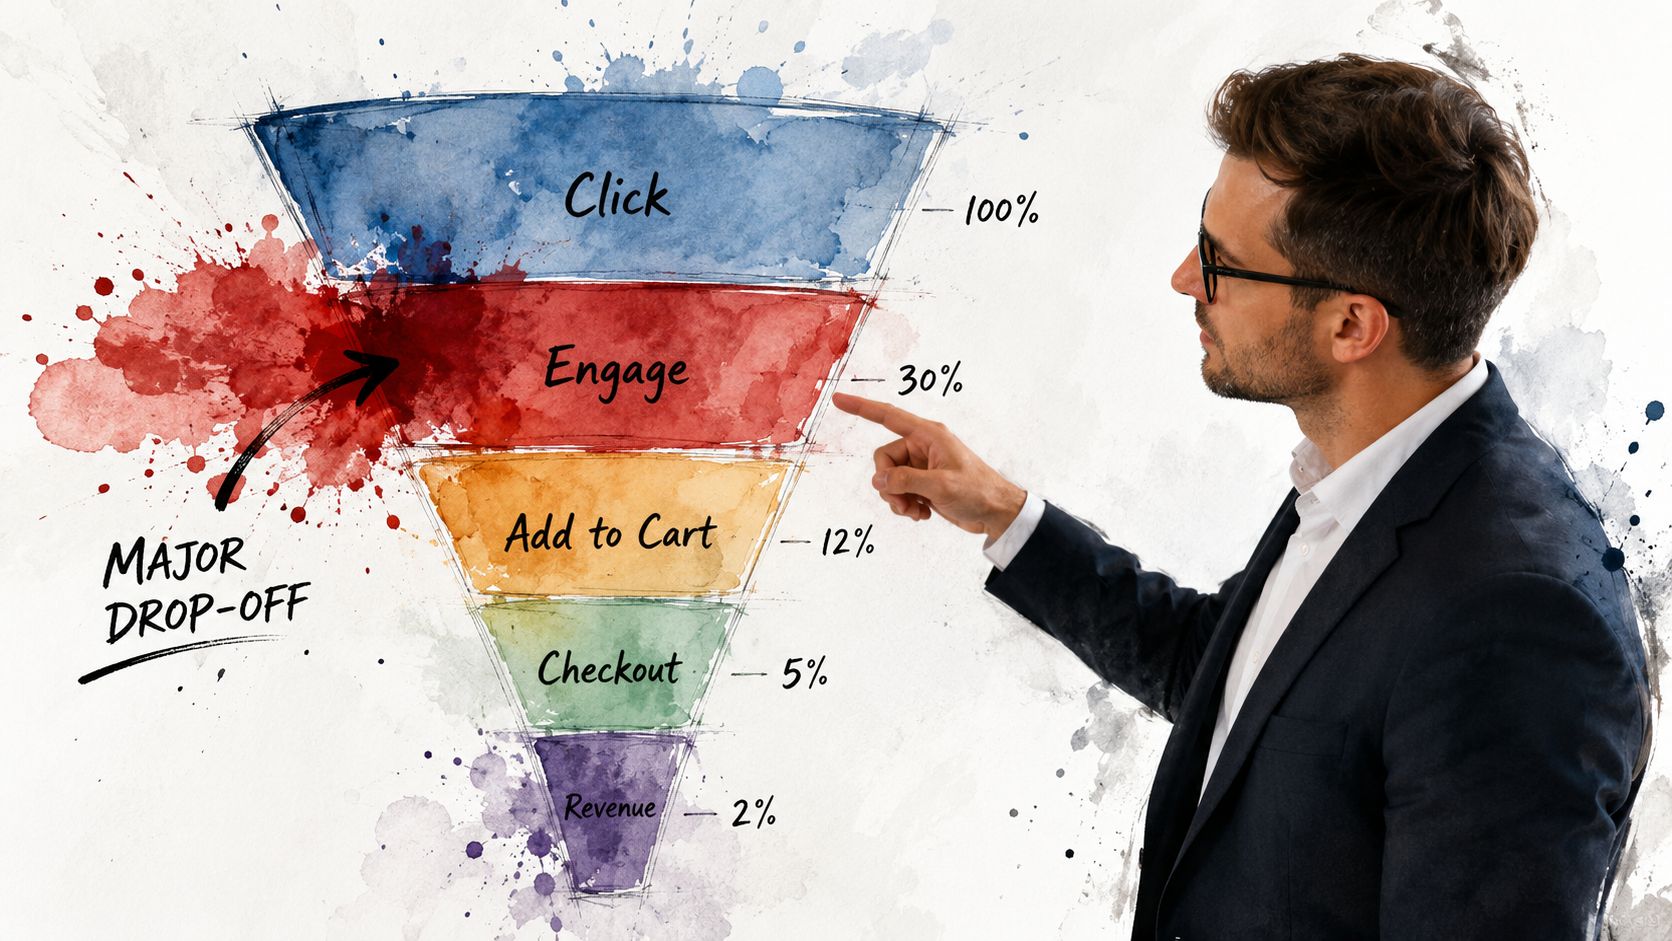
The practical payoff becomes clear once you stop treating the funnel as one number. Industry benchmarking guides often show that fixing one or two weak steps can improve completion rates without adding new features, and they also show how badly a headline rate can mislead when a single stage is underperforming. For example, common benchmark ranges for ecommerce checkout conversion, self-serve SaaS signup, freemium trial-to-paid conversion, checkout friction, and paywall conversion make one point obvious, a “good enough” top-line rate can still hide a broken step.
The Advertising Suite's explanation of CVR in digital marketing fits here, because CVR only helps once you know which stage is underperforming. Aggregate reporting can make a funnel look healthy when one stage is carrying the average and another is causing the main issues.
Practical rule: if a funnel looks fine at the top, inspect the step that asks for the most effort, trust, or commitment.
What healthy funnels actually look like
Healthy does not mean perfect. It means the stages make sense relative to the action being asked of the user, and the funnel is instrumented well enough to show where the drop happens. A checkout flow, a SaaS signup, and a freemium trial each have different expectations, so comparing them by a single final number wastes time and hides the underlying problem.
The bigger shift is mental. Funnel analysis moved growth work away from aggregate reporting and into stage-level diagnosis, which made conversion improvement measurable and actionable across digital markets. Once teams see the leak, the argument changes from “Is conversion down?” to “Which step is causing the loss?”
Mapping Your Funnel and Validating Instrumentation
Begin by mapping the journey before you plan any optimization. A funnel you cannot rebuild from raw events is not trustworthy enough to guide fixes, because optimization without clean instrumentation is just decorated guesswork. A practical workflow explicitly says to validate whether the funnel can be reconstructed from raw events, and if it cannot, the team is not ready to optimize FullSession's conversion funnel analysis workflow.
Define the steps before you define success
Map the journey from first touch to revenue, then separate macro steps from micro steps. Macro steps are the milestones tied to revenue, like signup, activation, or payment. Micro steps are the actions inside those milestones, like form completion, field validation, or plan selection.
Use plain-English definitions for every step. If sales calls a lead qualified, product calls it activated, and analytics calls it a conversion only after payment, you do not have one funnel. You have three narratives pretending to be one measurement system.
A simple test helps:
- Can each stage be described without jargon?
- Can the event be traced back to a raw action?
- Can another team rebuild the same funnel from the same definition?
If the answer to any of those is no, the funnel is too fuzzy to guide decisions.
Measure the right diagnostics, not just the end result
Track step conversion rate, drop-off rate, and time to next step. Those three signals show whether a stage is hard, slow, or misaligned with user intent. They also make it easier to separate a real abandonment problem from a flow that takes longer than expected.
A concrete trial example shows why this matters. If users start a free trial, some reach activation, and fewer of those activated users subscribe to a premium plan, the overall trial-to-paid conversion can look acceptable while the combined stage losses hide where intent breaks Userpilot's conversion funnel analysis example. That kind of compounding loss is exactly what a top-line metric hides.
If you cannot explain where the loss happens, you cannot explain what the fix should do.
Offline events belong in the operational layer of this work, because that is where many funnels fall apart in reporting. When a lead is generated in one system and closed in another, the funnel definition has to survive both environments or the analysis turns into a guessing game, which is why offline conversion tracking needs to be part of the event map.
The rule is blunt. Validate the event map first, then optimize. Anything else is movement without measurement.
Establishing Measurement Governance Across Channels
Most funnel failures come from governance gaps, not math errors. Marketing, sales, and product often measure the same action through different systems, then spend time arguing over whose number is “right” instead of agreeing on what the action means.
Pick one source of truth for each core action
The cleanest approach is to assign one primary reporting source to each key event, then let other tools serve as directional validation only. One system owns the source of truth for a signup, another may validate traffic behavior, and another may confirm revenue recognition, but none of them gets to redefine the event on the fly. A 2026 guide explicitly recommends this approach and says the definition should be documented in plain English, which tells you the issue is operational, not abstract Market with Boost's conversion funnel analysis guide.
That documentation matters more than many teams admit. If the CRM says a lead advanced, the web analytics platform says the session ended, and the ad platform says the click converted, someone still has to decide which event counts for the funnel stage being analyzed. Without that decision, funnel reporting turns into a political process disguised as analytics.
Reconcile disagreements instead of averaging them away
The goal is consistency in definitions, not identical numbers across every system. Different tools observe different parts of the journey, so disagreement is normal. The work is to understand what each source is good for, then trace the mismatch back to definition, timing, or attribution.
Use this sequence:
- Define the event in plain English. Write what happened, not how one tool labels it.
- Name the owner system. Decide which platform is authoritative for that action.
- Compare only like with like. Don't compare a downstream revenue event to an upstream click and call it a discrepancy.
- Use secondary tools for validation. Let them confirm direction, not rewrite the metric.
Measurement rule: when the systems disagree, start with the definition before you start blaming the data.
A governance layer also has to cover offline and cross-channel motion, because that is where many funnels break in reporting. When a lead starts in one system and closes in another, the funnel definition has to survive both environments or the analysis turns into guesswork, which is why customer behavior analytics belongs in the event map.
Scaling teams separate themselves from stalled teams here. The first group builds governance around the funnel and keeps moving. The second group keeps debating dashboards while the leak stays open.
Diagnosing Drop-Offs with Micro-Conversion Evidence
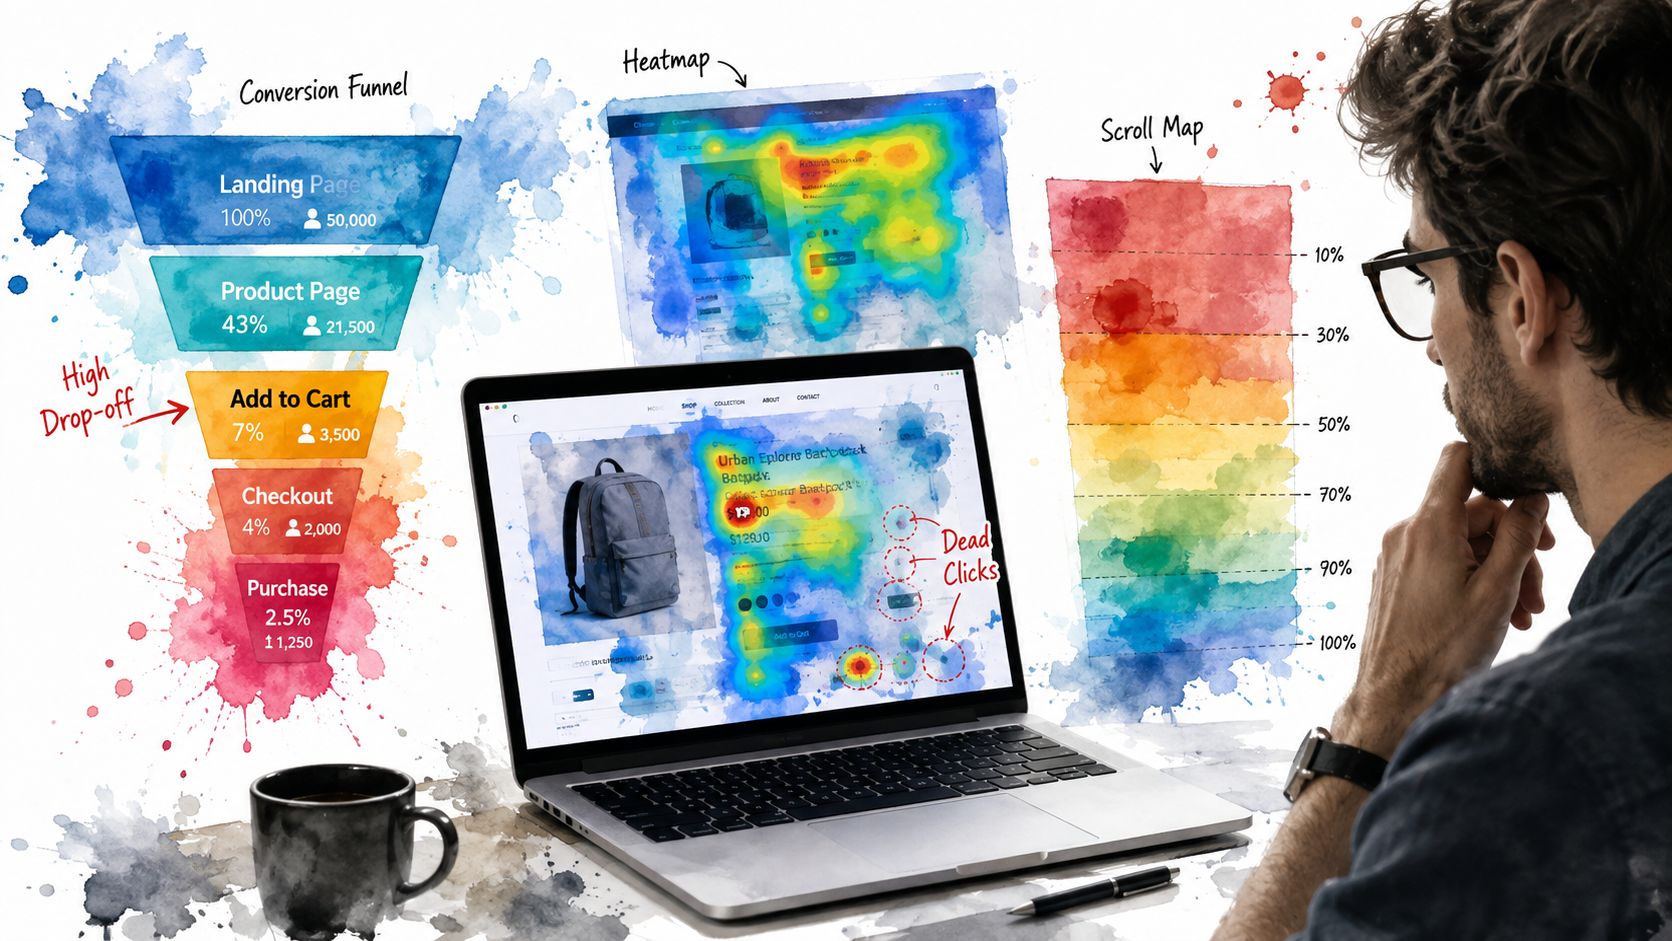
High-level funnel stages tell you where people are leaving. Micro-conversion diagnostics tell you exactly where intent dies inside the step. That's the difference between knowing a form is weak and knowing the phone number field is the reason it's weak.
Look inside the step, not just at the step
A better funnel analysis layers behavioral evidence on top of the metric trail. Heatmaps, scroll maps, dead clicks, rage clicks, session replays, and user-signal feedback reveal friction that a pageview funnel can't see. That matters because many guides stop at broad stages, while the loss often happens inside a form, a modal, or a toggle that users don't understand fast enough.
Segmentation sharpens the diagnosis further. Break the data by device, source, campaign, and behavior, then look for the segment that breaks first. A step that works on desktop but fails on mobile usually isn't a strategy problem, it's an interaction problem.
What micro-friction looks like in the wild
A new visitor lands on a pricing page, hovers over the plan comparison, and then repeatedly clicks a field that isn't clickable. That's a dead click, and it's telling you the interface is suggesting an action that doesn't exist. Another user starts onboarding, scrolls halfway through a long form, and rage clicks the submit button after an error message appears too late.
Those signals are more useful than a vague “drop-off” label. They tell you whether the problem is:
- A confusing field
- A slow-loading modal
- A pricing toggle that changes the mental model
- A permission request that arrives too early
Privacy constraints make this harder, not impossible. When user-level tracking is incomplete, aggregated behavior has to stand in for identity, which means you infer friction from repeated patterns rather than perfect tracing. That's why the best teams don't rely on one dataset alone.
The Advertising Suite's customer behavior analytics page fits naturally here because behavior evidence has to be interpreted, not merely collected. The point isn't more data for its own sake. The point is seeing the exact micro-step where intent collapses, then fixing that step instead of redesigning the entire funnel out of frustration.
Prioritizing Fixes and Running CRO Experiments
A long list of funnel leaks is usually a prioritization failure, not an ideas problem. Some issues are obvious and cheap to fix, while others are subtle, expensive, and tied to the exact step where purchase intent falls apart. The work is to rank the leaks by how much revenue they affect, how certain the diagnosis is, and how hard they are to change.
Use a prioritization matrix that forces trade-offs
A practical ranking framework uses impact, confidence, effort, and cost of delay. Impact asks how many users are affected and how close the issue sits to revenue. Confidence asks how clear the diagnosis is. Effort asks what it'll take to ship the fix. Cost of delay asks what the business loses by waiting.
| Criteria | What to Evaluate | Scoring Guidance |
|---|---|---|
| Impact | How much traffic, intent, or revenue passes through the leak | Prioritize steps that sit closest to activation or purchase |
| Confidence | How clear the root cause is from behavioral and quantitative evidence | Score higher when multiple signals point to the same issue |
| Effort | Design, engineering, QA, and coordination required | Favor changes that remove friction without a full rebuild |
| Cost of delay | What the business loses by waiting | Rank higher when the leak affects high-intent users repeatedly |
That matrix keeps teams from spending weeks on cosmetic tweaks while the bottleneck sits untouched. It also makes debate easier, because the discussion turns from opinion to evidence. In practice, the best ranking systems separate a noisy annoyance from a real revenue leak before anyone writes copy, opens a ticket, or starts a redesign.
Run tests that target revenue, not applause
A CRO experiment should answer one question, did this reduce friction at the stage that matters? That means the test has to be tied to a funnel step, not just a click increase or a prettier interface. If the stage is upstream, a small simplification may outperform a full redesign. If the stage is confusing, a bigger structural change may be the only honest option.
The economics justify that discipline. Recent funnel-optimization reporting says that for every $92 spent on customer acquisition, only $1 is spent on converting that traffic into customers, and that structured CRO programs can deliver an average ROI of 223%, or more than $3 in revenue per $1 invested. The same reporting says 68% of businesses lack a fully defined, documented, or measured sales funnel strategy, which explains why so many experiments feel random instead of cumulative.
Rule of thumb: if the test doesn't reduce friction, it's decoration.
Recent funnel-optimization reporting also points to a measurement problem that many teams ignore. If the funnel is not documented cleanly, test results get misread, and teams end up optimizing the wrong step because the underlying stage definition was never stable in the first place. The Advertising Suite's marketing dashboard page matters here because a dashboard should support decisions, not just report outcomes after the fact.
Building Dashboards and Privacy-Aware Automation
A funnel analysis that lives in a spreadsheet ages badly. The version that helps a team is a live measurement system, one that shows stage-level movement fast, alerts the right people when a step weakens, and stays useful under modern privacy constraints.
Build the dashboard around stages, not vanity totals
Dashboards should show the funnel as a sequence of transitions, not one inflated KPI. Each stage needs its own line of sight so the team can see where flow slows, where drop-off spikes, and where time to the next step stretches. When the dashboard only shows a headline conversion rate, nobody can tell whether the leak is early friction, mid-funnel hesitation, or a broken handoff near the end.
The Advertising Suite's marketing dashboard page belongs here because a good dashboard is an operating tool, not a report card. It should help teams catch degradation early enough to act, especially when traffic sources, CRM stages, and revenue events update on different clocks.
Automate alerts without pretending you have perfect identity
Privacy-aware automation has to work with partial signal loss. Alerts should fire on meaningful stage degradation, not on random fluctuation, and the logic should tolerate incomplete user-level tracking. That means the system needs guardrails, not blind faith in perfect attribution.
A useful setup starts with thresholds that reflect stage behavior, then layers in exception handling for missing identifiers and delayed downstream events. Recent benchmark reporting says AI-assisted funnel mapping can reduce drop-off versus manually managed funnels at the same traffic volume. The point is not that automation replaces judgment, it is that better mapping and faster pattern recognition reduce avoidable loss when identity is fragmented.
The smartest setup is simple:
- Dashboard the core stages. Keep the view readable.
- Alert on meaningful change. Do not train the team to ignore noise.
- Log the definition next to the metric. A number without context becomes a dispute.
- Connect CRM and reputation signals. Revenue does not end at the click, and customer experience does not end at the sale.
The integrated loop matters because the funnel does not stop at acquisition. Once CRM and reputation data sit beside acquisition data, the team can see whether the customer experience supports the revenue promise or erodes it after the lead converts. That is the difference between a dashboard that reports history and one that helps govern the funnel in real time.
Turning Funnel Insights Into Predictable Revenue
Conversion funnel analysis only becomes valuable when it changes how money is spent. That means fewer opinions, fewer vanity wins, and more decisions tied to the actual stages that move a buyer from interest to revenue. The strongest teams treat the funnel as a revenue system, not a reporting artifact.
The Advertising Suite's marketing ROI guide belongs here because ROI only improves when the funnel is instrumented well enough to show where the return is being lost. Once you can see the leak, the next move is to fix the stage, align the customer experience, and keep the measurement honest.
The growth-tech hybrid model works because it blends human strategy with integrated CRM and reputation tools. That combination matters when the issue isn't just acquisition quality, but what happens after the click, after the form, and after the sale. Bottom-line optimization beats vanity metrics every time, because revenue is the only score that pays the bills.
If you want a team that treats funnel analysis as an operating discipline, not a slide deck, visit The Advertising Suite and book a Growth Consult. They'll help you find the leaks, reconcile the numbers, and turn your ad spend into a more accountable revenue engine.