
A store with a 3% e-commerce conversion rate can be thriving, barely breaking even, or actively destroying cash. The percentage doesn't tell you which one. Traffic intent, average order value, margin, acquisition cost, and repeat purchases decide whether that rate represents a healthy business or an expensive illusion.
Published benchmarks reinforce the problem. Global e-commerce conversion estimates sit in a persistently low range, but the headline changes materially with the denominator, sector, geography, and device mix. In 2025, one benchmark reported 2.58%, while another measurement showed 1.6% of global e-commerce visits converting in Q3, a difference explained by methodology rather than a sudden collapse in performance. (Benchmark context and methodology)
The useful question isn't, “What percentage should we hit?” It's, “Which visitors buy, what do they buy, and what are they worth after the first order?” That shift turns conversion rate from a vanity dashboard number into a revenue-quality signal.
Why Conversion Rate Alone Is a Vanity Trap
A 3% rate means three completed purchases for every hundred measured opportunities. It says nothing about whether those buyers came from expensive prospecting campaigns, branded search, repeat customers, or high-intent referrals.
Consider two stores with the same rate. Store A attracts discount-sensitive visitors through costly paid campaigns, sells low-margin products, and rarely gets a second purchase. Store B attracts returning customers and high-intent organic visitors, sells with healthier margins, and has strong retention. Their conversion rates match, but their economics don't even belong in the same meeting.
The percentage hides the revenue equation
Conversion rate matters because more completed purchases can increase revenue without requiring more traffic. But the rate only earns its place in a growth report when you read it beside:
- Traffic source, which reveals intent and acquisition cost.
- Average order value, which shows the revenue attached to each purchase.
- Lifetime value, which exposes whether the first order becomes a profitable customer relationship.
A store can raise conversion by pushing a heavy discount, then lose contribution margin and future pricing power. Another store can accept a lower initial rate because its customers reorder, refer others, and produce stronger lifetime economics.
Practical rule: Never approve a CRO winner from conversion rate alone. Check revenue per visitor, contribution margin, and downstream repeat behavior before shipping the change.
This is why ROAS versus ROI matters in the same conversation. A campaign can look efficient at the ad-platform level while acquisition costs, fulfillment, discounts, and returns leave the business with little profit.
Benchmark chasing creates bad priorities
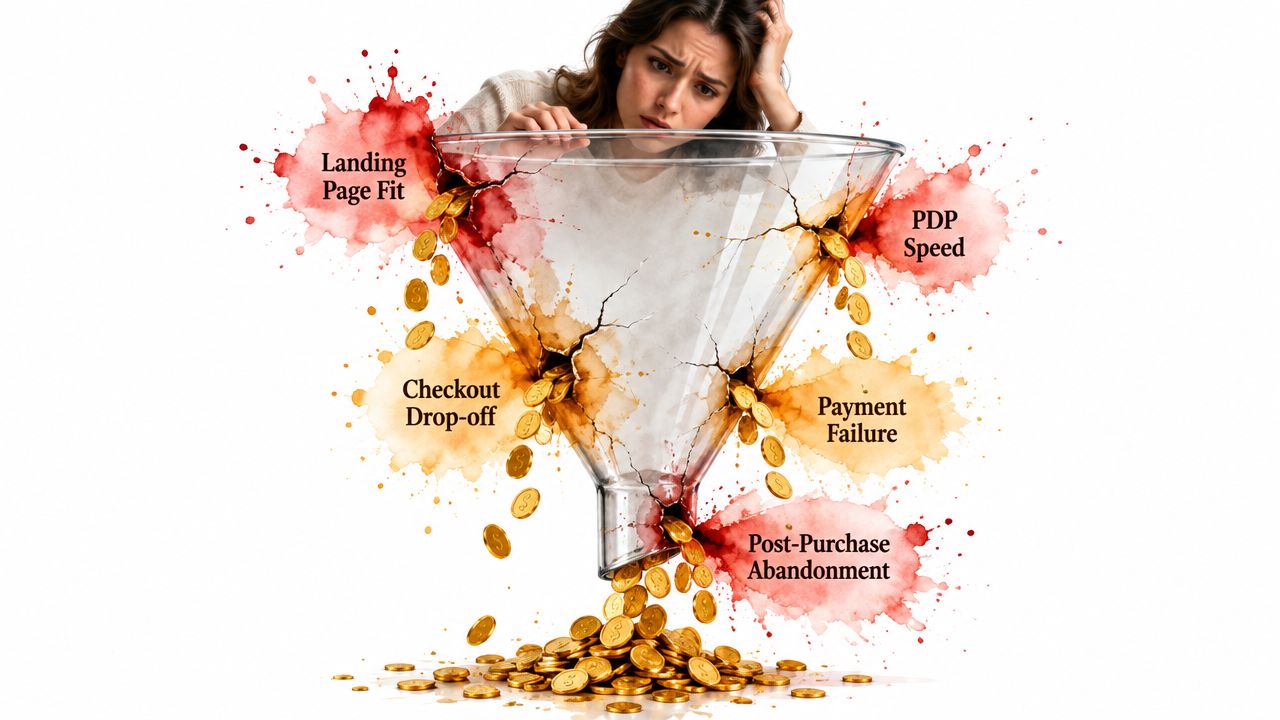
A generic benchmark can't tell you whether your leak sits on the landing page, product detail page, payment step, or post-purchase experience. It also can't tell you whether a lower rate reflects poor execution or a deliberate strategy built around premium pricing and longer consideration.
Use conversion rate to spot movement inside a controlled segment. Pair it with traffic quality and customer value to decide what deserves investment. The target isn't a prettier percentage. The target is more profitable revenue from the traffic you can acquire and retain.
The Real Formula and What the Denominator Hides
The basic calculation is straightforward:
Conversion rate = completed purchases ÷ measured opportunities × 100
Most e-commerce teams use sessions as the denominator. A session-based rate therefore equals transactions divided by sessions multiplied by 100. A user-based rate divides purchases by unique users during the same period, which answers a different question. (Session-based conversion definition)
The arithmetic isn't the difficult part. The difficult part is defining the opportunity and choosing a denominator that stays consistent across reporting periods.
One store can tell two different stories
Suppose a store records the following during a reporting period:
- Session-based rate: 2.8%
- User-based rate: 4.6%
Neither figure is automatically wrong. The gap can arise when shoppers return several times before purchasing, research on one device, or revisit through different entry points. A leadership team that sees only the session figure may conclude that buying intent is weak. A team that sees only the user figure may underestimate the friction created by repeat visits and cross-device behavior.
| Dimension | Session-based rate | User-based rate |
|---|---|---|
| Denominator | Measured sessions | Unique users |
| Best for | Operational funnel monitoring | Person-level buying intent |
| Main distortion | Repeat visits count as separate opportunities | Identity resolution can be incomplete |
| Reporting requirement | Consistent session rules | Reliable user stitching |
| Decision use | Find page and checkout leaks | Evaluate customer-level conversion quality |
Make the denominator explicit
Document four definitions before comparing performance:
- Conversion event, such as a completed purchase rather than an add-to-cart.
- Denominator, sessions or users.
- Attribution window, the period in which a purchase belongs to the visit or campaign.
- Exclusions, including internal traffic, test orders, and duplicate events.
Then segment the rate by channel, device, landing template, product category, and new versus returning users. A blended number can move because the traffic mix changed, even when every underlying segment improved.
Revenue decisions also need cost context. A contribution margin analysis connects conversion with discounts, fulfillment, fees, returns, and acquisition costs. That's the difference between counting orders and understanding profitable orders.
Benchmarks That Matter in 2026
A global average offers a starting hypothesis for investigation. One long-running benchmark summary places the worldwide range around 2.3% to 2.7% for much of the past decade, while another independent summary places global conversion broadly between 1.4% and 3.0%, depending on measurement and sample mix. (Global benchmark range and methodology)
Country data shows why geography belongs in every comparison. Adobe's 2022 benchmark reported 2.3% in the United States, 2.22% in Germany, 1.80% in Denmark, 1.78% in the Netherlands, 0.99% in Italy, and 4.1% in the United Kingdom. These figures reflect different logistics, payment expectations, brand familiarity, and traffic composition. Use the closest market context before changing budgets or setting targets. (Country benchmark data)
Category changes the ceiling
Sector benchmarks vary sharply. Shopify's cited 2026 figures report 4.58% for food and beverage, 5.32% for beauty and personal care, 2.77% for fashion, 1.29% for home and furniture, and 0.63% for luxury and jewelry.
| Category | Desktop rate | Mobile rate | Top quartile |
|---|---|---|---|
| Food and beverage | Not provided in verified data | Not provided in verified data | Not provided in verified data |
| Beauty and personal care | Not provided in verified data | Not provided in verified data | Not provided in verified data |
| Fashion | Not provided in verified data | Not provided in verified data | Not provided in verified data |
| Home and furniture | Not provided in verified data | Not provided in verified data | Not provided in verified data |
| Luxury and jewelry | Not provided in verified data | Not provided in verified data | Not provided in verified data |
The table stays blank where the evidence provides no category-by-device quartiles. Plausible-looking numbers would create false precision and encourage poor revenue decisions.
Device and mix matter more than a headline
Benchmark summaries commonly place mobile conversion around 1.5% to 2.5% and desktop around 3.5% to 4.5%. (Device benchmark context) The gap may indicate mobile friction, or it may show shoppers researching on phones and purchasing elsewhere.
Use this decision rule:
- Compare your category with the same category.
- Compare mobile with mobile and desktop with desktop.
- Compare paid social with paid social, email with email, and search with search.
- Compare the same denominator and conversion event.
- Ground targets in segmented, category-specific data.
A single global average is weak guidance for budget decisions. Your own segmented history is the control group, especially when those segments reveal which visitors become profitable customers and return for future purchases.
Where the Money Leaks in Your Funnel
Revenue rarely disappears at one dramatic point. It leaks through small breaks in confidence, unexpected costs, difficult forms, slow pages, and traffic that reaches a mismatched offer. Treat conversion rate as a revenue-quality signal: the right fix attracts and converts customers who can produce healthy margin and repeat purchases.
Diagnose the leak before choosing the fix
Begin with the first meaningful interaction and identify what blocks the next step.
Landing page to product view: Broad advertising often sends visitors to pages built around a different promise. Match the headline, offer, product, and audience intent. A shopper seeking a specific solution will rarely convert on a generic category page, regardless of how much you refine checkout.
Product page to cart: Missing variant images, unclear delivery details, weak reviews, and vague benefits create hesitation. Place the evidence needed for a decision beside the purchase control, where it can reduce uncertainty before the shopper leaves.
Cart to checkout: Show the full cost early. Set clear stock and delivery expectations, then test concise reassurance beside the primary action. Remove unanswered questions instead of adding decorative elements.
Map each stage with a conversion funnel analysis so the team can assign every leak to an observable behavior and an economic outcome.
Checkout remains the largest recoverable leak
A widely cited multi-study aggregation places cart abandonment at around 70% globally, meaning roughly seven in ten shoppers who add products to a cart do not complete the purchase. (Checkout friction and abandonment benchmark)
Prioritize structural changes:
- Guest checkout: Let shoppers pay without creating an account first.
- Wallet payments: Reduce typing and form fatigue with familiar payment choices.
- Trust at the decision point: Show returns, delivery, security, and support information where uncertainty peaks.
- Useful recovery: Segment abandoned-cart messages by the observed barrier instead of offering every shopper the same discount.
Post-purchase leakage matters just as much for customer economics. A poor delivery experience, weak onboarding, or missing replenishment prompt can turn a completed order into a one-time transaction. Track repeat behavior by acquisition source and first product, then protect the traffic that produces durable customers, even if its initial conversion rate looks less impressive.
Treat mobile as its own funnel
Mobile typically converts below desktop. Benchmark summaries report 1.5% to 2.5% on mobile versus 3.5% to 4.5% on desktop. Do not treat a resized desktop layout as mobile optimization.
Review tap targets, sticky purchase controls, image loading, address entry, payment selection, error handling, and overlay interruptions. Rank issues by lost revenue and customer value, not by how easy they are for a designer to fix.
Use this diagnostic sequence:
- Which stage loses the most potential buyers?
- Which device and source create the largest dollar-weighted gap?
- Is the cause intent, clarity, trust, speed, or payment?
- What change can isolate that cause?
- Will the result improve margin and customer value, or only the rate?
Measure the result against segment-level economics, traffic quality, and future customer value rather than a headline benchmark.
AI Traffic, Privacy, and the New Conversion Math
AI referrals and privacy restrictions are changing what a conversion rate represents. AI-referred sessions may bring fewer visitors with more specific intent, while missing referrer data can place some of those visits in direct traffic. Treat the source classification as a measurement problem before treating the rate as a performance result.
Recent reporting found AI-referred retail visitors converting 54% higher than non-AI traffic in May 2026. Use that finding as a source-specific observation, not as a multiplier for every store. (AI referral and channel context)
Stop blending unlike visitors
A blended rate conceals differences between product researchers, returning customers using saved links, and prospects responding to a highly specific recommendation. Build separate views for:
- Acquisition source, including identifiable AI referrals where measurement permits.
- Landing intent, such as product-specific, problem-specific, or brand-led entry.
- New and returning users, because their expected customer value differs.
- First purchase and repeat purchase, because an immediate order does not define the full outcome.
Your channel report should pair conversion with revenue per visitor, acquisition cost, contribution margin, and later customer value. A smaller source can deserve more budget when it produces repeat orders and healthier margins. A high conversion rate from low-value, discount-dependent traffic is not a growth win.
Privacy changes the quality of the denominator
Cookie restrictions, consent choices, and incomplete cross-device identity make historical comparisons fragile. A visit that previously carried a clear source may now appear direct. Research on one device and purchase on another can also split one buying journey into separate records.
Capture first-party signals with restraint and a clear value exchange:
- Post-purchase surveys asking what prompted the order.
- Account creation that improves continuity for willing customers.
- Quiz or preference flows that help shoppers find a suitable product.
- Permission-based email or SMS capture tied to useful updates.
Review guidance on data privacy in marketing before adding tracking or personalization. First-party data should improve segmentation, attribution, and the connection between a first order and later value. Collecting more fields without a defined use only creates compliance and data-quality problems.
| Channel | Average conversion rate | Revenue quality note |
|---|---|---|
| AI-referred retail traffic | Not provided as a universal average | Recent reporting found higher conversion than non-AI traffic in one May 2026 observation |
| Not provided in verified data | Often reflects an existing relationship and should be evaluated for repeat value | |
| Paid social | Not provided in verified data | Intent can vary widely between prospecting and retargeting |
| Organic search | Not provided in verified data | Query specificity and landing-page alignment matter |
| Direct | Not provided in verified data | May combine loyal users, untracked referrals, and typed journeys |
The operating rule is simple: optimize channel economics, then use conversion rate to explain revenue quality. Judge each source by the customers and margin it creates, not by a blended percentage that hides intent, attribution gaps, and future value.
A Practical A/B Testing System That Compounds
A testing program fails when the hypothesis is vague, the tracking is unreliable, or the team stops the experiment after seeing a flattering early result. More ideas won't solve that. Better operating discipline will.

Establish the measurement contract first
Before changing a button, verify that purchase, revenue, refunds, discounts, and device data are recorded consistently across your analytics and commerce systems. Different event implementations can disagree, and a broken purchase event can make a winning variant look worthless.
Choose one primary outcome and supporting guardrails:
- Primary: Revenue per visitor or contribution-adjusted revenue.
- Secondary: Completed purchase rate and average order value.
- Guardrails: Refunds, cancellations, margin, support contacts, and repeat purchase signals.
Pre-register the minimum detectable effect before launch. The requested plan suggests a 10% to 15% relative conversion lift as a practical threshold for many SMB experiments, but the right threshold depends on traffic, baseline rate, business value, and test capacity. Don't pretend that a small store can reliably detect tiny changes on demand.
Write hypotheses that can lose
Use this structure:
Because [observed behavior], changing [specific element] for [specific segment] will increase [defined metric] by [defined amount], because [behavioral reason].
A useful hypothesis might connect repeated form errors on mobile with a shorter checkout variant. A weak hypothesis says the page should “feel cleaner.” The first can be investigated. The second is a design opinion wearing a lab coat.
Run one major test at a time when traffic and engineering capacity are limited. Set the test window in advance, avoid stopping after a convenient spike, and define the stop-loss rule before results arrive. Statistical confidence matters, but confidence doesn't repair a contaminated event stream.
Turn outcomes into institutional memory
After each test, record:
- What the team observed.
- Which segment responded.
- Whether revenue quality improved.
- What failed and why.
- Which assumption should be retired.
Archive completed tests monthly, cluster themes quarterly, and maintain an annual kill list of ideas that repeatedly failed. A test that loses can still improve the business if it prevents the same expensive assumption from returning in a new design.
For a fuller experiment structure, use this guide to designing experiments. The compounding advantage doesn't come from running more tests. It comes from learning faster and shipping only changes that survive economic scrutiny.
From One-Time Fix to Revenue System
CRO isn't a redesign project with a launch date. Conversion changes when seasonality, traffic mix, assortment, pricing, promotions, fulfillment, and customer expectations change. A page that performed well in one quarter can become a liability after the business changes what it sells or who it attracts.
Give the work an operating rhythm
An always-on system needs three recurring motions:
- Weekly prioritization: Maintain a queue of observed leaks, ranked by expected revenue impact and implementation effort.
- Monthly review: Compare segmented conversion, revenue per visitor, contribution margin, and customer quality with the prior period.
- Quarterly audit: Check event integrity, consent behavior, identity resolution, attribution logic, and funnel definitions.
The team should assign clear ownership. A strategist prioritizes opportunities and writes hypotheses. Technical owners protect instrumentation and release speed. Merchandising, customer support, and paid acquisition contribute evidence because conversion problems often begin outside the page itself.
A winning test isn't the system. The system is the reason you keep finding the next profitable test.
Tie every meaningful experiment to a lifetime-value projection. A change that improves first-order conversion but attracts refund-prone customers may not deserve rollout. A change that produces a modest immediate lift while improving repeat purchase quality may be the stronger investment.
A 90-day rollout that survives contact with reality
Week one: Establish the baseline, document conversion events, audit tracking, and reconcile revenue against the commerce system.
Weeks two through four: Fix obvious checkout friction, mobile usability problems, missing trust information, and unclear delivery costs. These are not glamorous projects, which is precisely why teams often ignore them.
Weeks five through twelve: Run structured experiments against the highest-value leaks. Keep the hypothesis, audience, primary metric, guardrails, sample requirement, and stopping rule visible to everyone involved.
The finish line isn't a higher dashboard percentage. It's a compounding revenue engine that connects acquisition quality, customer experience, margin, and lifetime value. That is the standard growth teams should use when deciding whether CRO is working.
The Advertising Suite helps businesses turn conversion data into profitable growth through strategy, funnel optimization, omnichannel execution, and an integrated CRM and reputation ecosystem. Request a growth-focused conversation with The Advertising Suite to audit your traffic quality, identify the highest-value leaks, and build a testing system that works as an extension of your team.