Many teams attempt to reduce customer acquisition cost by purchasing lower-cost traffic. That's often an ineffective initial step. Across tracked businesses, one widely cited benchmark reports that CAC rose about 60% over five years, while a separate 2026 industry summary reports an increase of roughly 222% over eight years across tracked businesses (customer acquisition cost benchmark data). Inexpensive clicks won't fix a funnel that draws the wrong buyers, loses qualified leads, and struggles to keep customers.
The better approach is a connected system. Measurement discipline tells you where CAC is high, creative and offer fit improves traffic quality, conversion infrastructure turns more visits into customers, and retention-driven LTV gives each acquired customer more time to repay the investment. Treat these levers separately and your team will optimize symptoms. Connect them and acquisition economics can improve at the business level.
Why Your Customer Acquisition Cost Will Keep Climbing Unless You Fix the System
CAC has roughly tripled across tracked businesses in eight years. The exact benchmark varies by dataset and business mix, but the direction is clear. Rising competition, privacy-rule changes, and fragmented attribution have made every new customer harder to identify, reach, convert, and retain (CAC trend analysis).
Teams respond by staring at one blended number. They combine paid media, sales salaries, creative production, software, partnerships, and organic activity, then divide the total by new customers. That calculation is useful as a financial overview, but it's a poor operating diagnosis. A high blended CAC doesn't tell you whether the problem is an expensive channel, weak qualification, slow sales follow-up, poor onboarding, or low repeat purchase behavior.
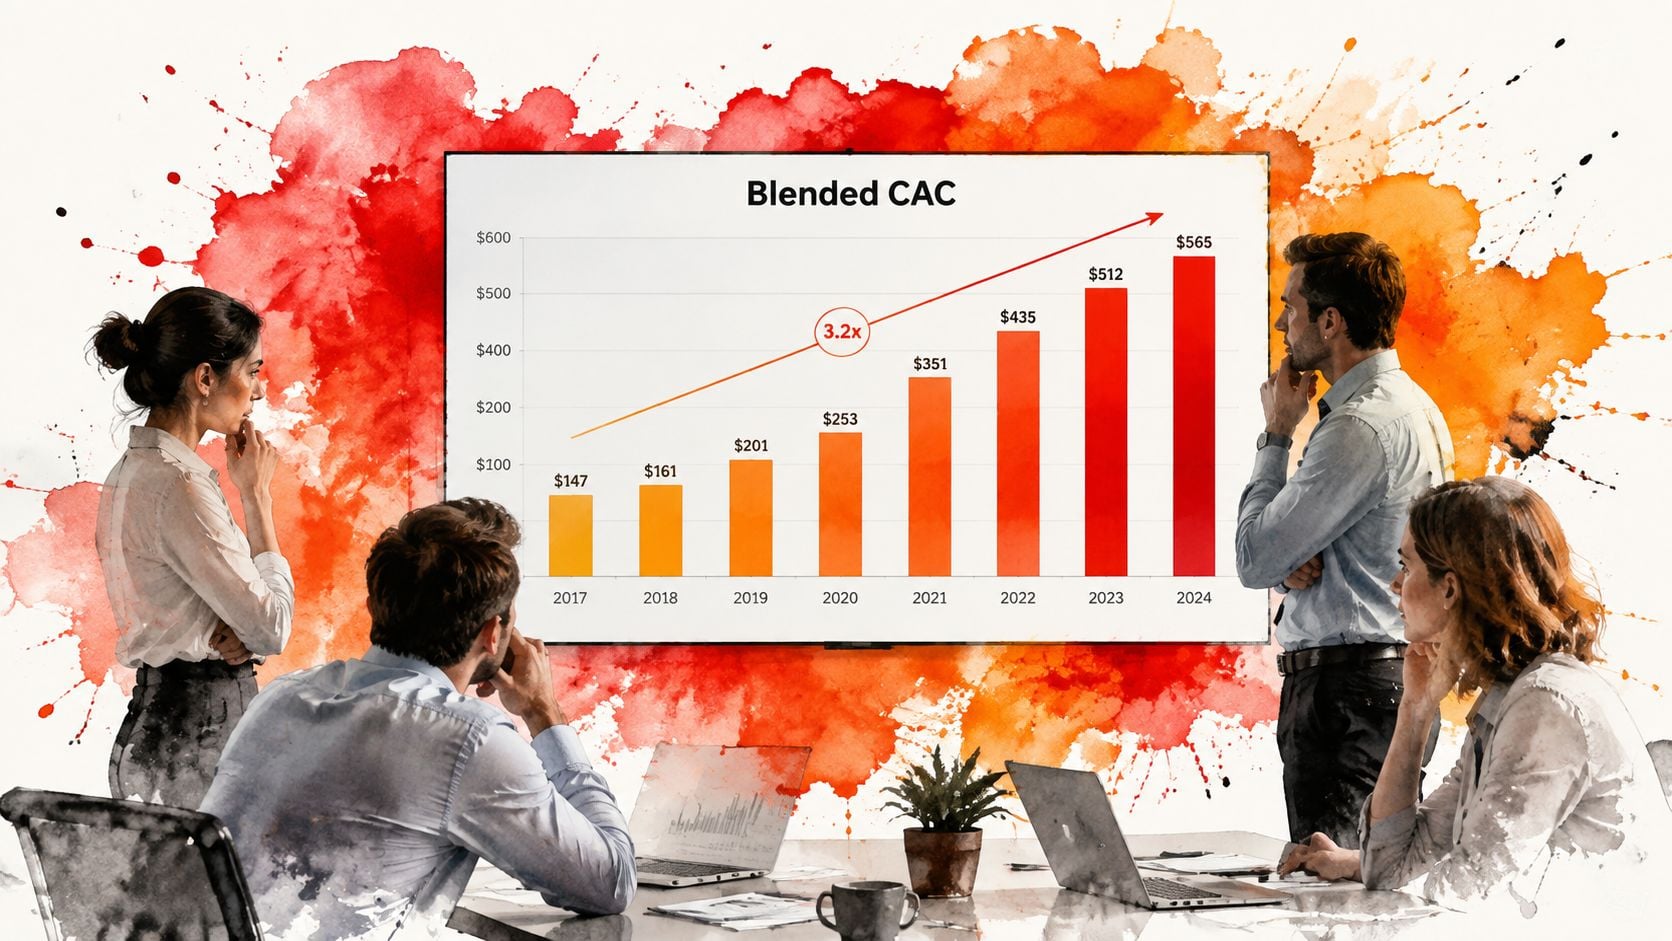
Stop treating blended CAC as a verdict
Segment CAC by channel, campaign, audience, geography, product line, and customer cohort. Then add payback period. A channel can look expensive at first glance yet produce customers who activate quickly, retain well, and expand. Another can report attractive platform efficiency while sending low-quality leads that sales can't close.
Practical rule: Don't ask only, “Which channel has the lowest CAC?” Ask, “Which channel produces customers who repay acquisition spend quickly and stay valuable?”
The four-lever system is straightforward:
- Measurement discipline: Build trustworthy channel and cohort reporting, then reconcile marketing data with CRM and finance records.
- Creative-offer fit: Match the message, audience, proof, and offer to the customer's actual buying motivation.
- Conversion infrastructure: Remove friction from landing pages, forms, onboarding, checkout, and sales handoffs.
- Retention-driven LTV: Improve activation, repeat purchase, expansion, referrals, and win-back performance so acquired customers generate more gross-margin dollars.
These levers compound. Better measurement identifies the funnel stage worth fixing. Better creative sends more qualified visitors into that stage. Better conversion infrastructure creates more customers from the same demand. Better retention makes additional acquisition investment defensible.
Use marketing budget allocation guidance to connect spending decisions to those economics, not to activity levels. The objective isn't to make every channel look efficient. It's to direct more investment toward customers, offers, and journeys that create durable revenue.
Measuring CAC, LTV, and Payback the Right Way
Start with the basic calculation:
CAC = total sales and marketing costs ÷ new customers acquired
Include the costs that support acquisition, not just media spend. Depending on your model, that can include campaign production, sales labor, acquisition software, promotions, lead management, and the operational work required to convert a prospect.
Calculate CAC three ways:
- Paid CAC: Paid acquisition costs divided by customers attributable to the paid motion.
- Channel CAC: The cost assigned to one channel divided by customers acquired through that channel.
- Blended CAC: Total sales and marketing costs divided by all new customers.
Blended CAC belongs in financial planning. It shouldn't be the only number used for optimization.
Add payback to every acquisition decision
CAC payback measures how long it takes gross-margin contribution from a new customer to recover acquisition spend. Use gross margin rather than revenue, because revenue that doesn't cover fulfillment, service, payment, or delivery costs can create false confidence.
For B2B SaaS, commonly cited discipline targets include CAC payback under 12 months for SMB customers and under 18 months for mid-market customers, alongside an LTV:CAC ratio of at least 3:1 (B2B SaaS CAC methodology). The same source notes that spending more than 33% of average customer lifetime value on acquisition generally signals inefficient allocation.
The table below uses those benchmarks where they're defined. Don't invent a “healthy” blended CAC range without your own pricing, margin, sales cycle, and retention data.
| Business Model | Blended CAC Range | Payback Period | LTV:CAC Ratio |
|---|---|---|---|
| SMB SaaS | Business-specific | Under 12 months | At least 3:1 |
| Mid-market SaaS | Business-specific | Under 18 months | At least 3:1 |
| Ecommerce | Business-specific | Model-specific | At least 3:1 as a directional discipline |
| Local services | Business-specific | Model-specific | Compare against margin and repeat value |
Build a measurement checklist
Your reporting should answer five questions:
- Where did the customer originate? Separate paid, organic, partner, referral, direct, and offline sources.
- What did the customer buy? Break out product, service, plan, location, and order type.
- How fast did the customer repay CAC? Track gross-margin payback by cohort.
- Did the channel create incremental demand? Use controlled testing instead of accepting platform attribution as proof of causality.
- Does the CRM agree with finance? Reconcile leads, closed customers, refunds, revenue, and gross margin.
Incrementality testing compares a marketing-exposed test group with a statistically identical control group withheld from that activity. It helps isolate causal lift when remarketing, view-through conversions, and cross-channel overlap make platform attribution look better than the blended business result (incrementality testing methodology).
Once this foundation exists, every creative, funnel, and retention decision has an economic consequence. Without it, your team is mostly guessing with better-looking dashboards. For a broader framework, use this guide to calculate marketing ROI.
Benchmarking Your Numbers Against 2026 Channel and Industry Reality
A “good” CAC depends on what you sell, where you sell it, how much customers pay, and how much margin remains after fulfillment. A benchmark can expose an outlier, but it can't replace cohort analysis.
One 2026 benchmark summary reports average cross-industry CAC at about $395, with organic search around $70 to $120, content marketing around $92, and paid search roughly $200 to $350 (2026 CAC channel benchmarks). The same summary reports approximately $644 for financial services, $395 for technology, and up to $1,672 for fintech. These are not universal targets. They show why channel mix and industry economics can change acquisition costs by multiples.
Use peer positioning, not average chasing
Ecommerce provides a useful illustration. One benchmark reports a median CAC of $87, while top-quartile operators acquired customers for about $42 in the same category (ecommerce CAC benchmark comparison). The lesson isn't that every ecommerce brand should reach $42. It's that execution quality can create a wide gap inside one market.
| Channel | Ecommerce CAC | B2B SaaS CAC | Local Services CAC |
|---|---|---|---|
| Organic search | About $70 to $120 benchmarked across tracked businesses | Business-specific | Business-specific |
| Content marketing | About $92 benchmarked across tracked businesses | Business-specific | Business-specific |
| Paid search | Roughly $200 to $350 benchmarked across tracked businesses | Business-specific | Business-specific |
| Partnerships and referrals | Measure by program and cohort | Measure by program and cohort | Measure by program and cohort |
| Offline channels | Measure by campaign and geography | Measure by campaign and geography | Measure by campaign and geography |
The table's business-specific entries are intentional. There isn't verified data here that supports a universal CAC range for every model and channel combination.
Normalize before making a decision
Compare like with like:
- Match market conditions: Geography, competition, brand awareness, and customer intent can change costs.
- Match customer economics: Compare CAC with average revenue, gross margin, retention, and sales effort.
- Match attribution rules: A channel credited with a conversion isn't automatically the channel that created demand.
- Match cohort quality: Check whether customers renew, reorder, refer, or expand.
Offline campaigns and video advertising also need a disciplined measurement plan. Use YouTube advertising cost guidance as a planning input, then judge the channel by qualified customers and incrementality rather than impressions alone.
Averages are useful for finding questions. Your own segmented payback data should answer them.
Building the Creative and Offer Testing Engine
Creative testing fails when teams confuse publishing volume with learning. Launching many ads without isolating the variable under examination creates noise, then the team calls the loudest result a winner.
Test four layers in sequence:
- Hook: The opening claim or tension that earns attention.
- Angle: The problem, desired outcome, objection, or use case the ad emphasizes.
- Offer: The reason to act now, such as a consultation, trial, bundle, guarantee, or promotion.
- Landing-page alignment: The degree to which the destination repeats and proves the promise made in the ad.

Run a learning cadence
A practical weekly rhythm is:
- One hook test: Keep the audience, offer, and destination stable.
- One angle test: Change the customer problem or desired outcome, not every visual element.
- One offer test: Compare the incentive or next step while preserving the strongest message.
- One public service announcement or holdout: Reserve part of the activity for an incrementality read.
The purpose isn't to produce a new creative every week. It's to build evidence about what moves qualified customers.
Kill weak ideas for the right reason
Don't shut down an ad because its click-through rate looks ordinary. Don't scale it because its attributed ROAS looks impressive. Review:
- Cost per acquired customer: Does the actual customer cost fit the payback requirement?
- Click-to-customer rate: Do visitors become qualified buyers, not just engaged users?
- Incremental lift: Did the campaign create additional conversions beyond what would have happened without exposure?
- Post-purchase quality: Do customers activate, retain, reorder, or expand?
Incrementality-adjusted ROAS should become the decision layer, while platform attribution remains diagnostic context (controlled lift testing guidance).
Scale winners gradually. Preserve the core promise, then vary format, proof, audience framing, or creative execution. A winning ad can deteriorate when budget expansion changes delivery quality or reaches less qualified prospects.
Common failure modes include testing with insufficient spend to produce a useful signal, declaring winners too early, changing multiple variables at once, and optimizing toward blended channel metrics. Use multivariate testing guidance when you have enough traffic and a clear reason to test interactions. Sequential testing creates cleaner decisions and less wasted budget.
Fixing the Leaky Funnel That Inflates Every Click You Buy
Every dollar spent on traffic meets a second cost after the click. If the page loads slowly, the promise feels mismatched, the form asks for too much, or sales responds late, the campaign pays for visitors who never had a fair chance to convert.
Start with the first decision point. The landing page should repeat the ad's central promise above the fold, explain who the offer serves, show credible proof near the point of hesitation, and present one primary action. A beautiful page with competing calls to action is still a leaky bucket.
Diagnose the stage, not the symptom
| Funnel Stage | Typical Conversion Range | Primary Leak Driver | High-Leverage Fix |
|---|---|---|---|
| Landing page | Business-specific | Message mismatch, slow load, weak proof | Align headline and offer, simplify the page, improve speed |
| Lead form | Business-specific | Excessive fields or unclear value | Reduce friction and explain the next step |
| Sales handoff | Business-specific | Slow response or poor qualification | Route leads quickly and define qualification rules |
| Onboarding | Business-specific | Confusing first-use experience | Guide customers to the first meaningful outcome |
| Checkout | Business-specific | Unexpected costs, trust gaps, payment friction | Clarify terms, reinforce trust, recover abandoned sessions |
The “typical conversion range” remains business-specific because no verified dataset here supports universal funnel-stage percentages. Use your own baseline and calculate conversion rate as total conversions divided by total visitors, multiplied by 100 (conversion rate optimization formula).
Fix speed and message match first
Site performance deserves a direct test. One source reports that making a website one second faster can lift conversions by 7%, while loading in two seconds or less can increase conversions by 15% (site speed and conversion data). Treat those figures as source-specific benchmarks, not guaranteed outcomes for every site.
For SaaS, inspect trial activation and the first successful workflow. For ecommerce, inspect product-page clarity, shipping expectations, payment friction, and recovery flows. For local services, inspect qualification, mobile usability, and the time between form submission and a real call.
The highest-value CRO test is often the least glamorous one: make the promise clearer, remove one obstacle, and ensure a human responds while intent is still high.
Track conversion by device, campaign, geography, and customer quality. A landing page can improve its conversion rate while sending more unqualified leads into sales. That's not CAC reduction. It's cost relocation.
Turning Retention and LTV Into Your Hidden CAC Lever
Lowering the first-sale CAC isn't always the best economic decision. A higher-CAC channel can be cheaper if it produces customers with stronger gross-margin retention, faster activation, more repeat purchases, or greater expansion.
That's why payback period matters. Calculate cumulative gross-margin contribution by cohort and compare it with the acquisition cost assigned to that cohort. A customer who repays acquisition spend quickly can justify a higher upfront investment than a cheaper customer who churns before creating meaningful margin.
Improve the value of every acquired customer
Retention work should begin immediately after conversion:
- Activation: Guide the customer to a meaningful first outcome with clear onboarding.
- Usage: Reinforce the behaviors that make the product or service useful.
- Expansion: Offer relevant upgrades, additional services, or larger orders when the customer has demonstrated need.
- Win-back: Re-engage customers before inactivity becomes permanent.
- Referral: Make it easy for satisfied customers to recommend the business.
For local and service businesses, reputation is part of this loop. A source associates a one-star Yelp increase with a 5% to 9% revenue increase for restaurants, and reports that businesses with 25 or more reviews can earn 108% more revenue than average (review and revenue data). Treat those figures as reported associations, not guaranteed results.
Another source reports that businesses with more than nine current reviews accrue 52% more revenue on average, while businesses responding to at least 25% of reviews earn 35% more than unresponsive businesses (review responsiveness benchmarks). The operational point is stronger than the vanity metric. Review volume and response behavior can influence trust at the moment a prospect chooses whether to contact you.
Connect retention reporting to acquisition
Review LTV by acquisition channel and cohort, not only by company average. A channel with higher CAC may deserve more budget when its customers activate faster, retain longer, and generate healthier gross-margin payback.
Use customer lifetime value improvement guidance to create a weekly operating view that includes segmented CAC, activation, repeat purchase or renewal, gross-margin payback, and referral activity. Retention isn't a support-team metric. It's a direct input into how aggressively you can acquire the next customer.
The 30-60-90 Day Plan to Reduce Customer Acquisition Cost
A strong CAC program needs deadlines, owners, and decisions. Don't launch a vague “optimization initiative” that produces more dashboards and no budget changes.
Days 1 through 30 build measurement hygiene
Start by making the economics visible:
- Weeks 1 and 2: Define acquisition costs, customer events, gross-margin inputs, cohort rules, and ownership.
- Week 3: Report CAC by channel, campaign, geography, product, and customer cohort. Add payback and LTV:CAC.
- Week 4: Reconcile advertising, CRM, sales, refunds, revenue, and finance records. Pause clearly unprofitable activity and create a prioritized creative-testing backlog.
Don't optimize what the finance team can't reconcile. If your CRM says one thing and booked revenue says another, repair the data path before increasing spend.
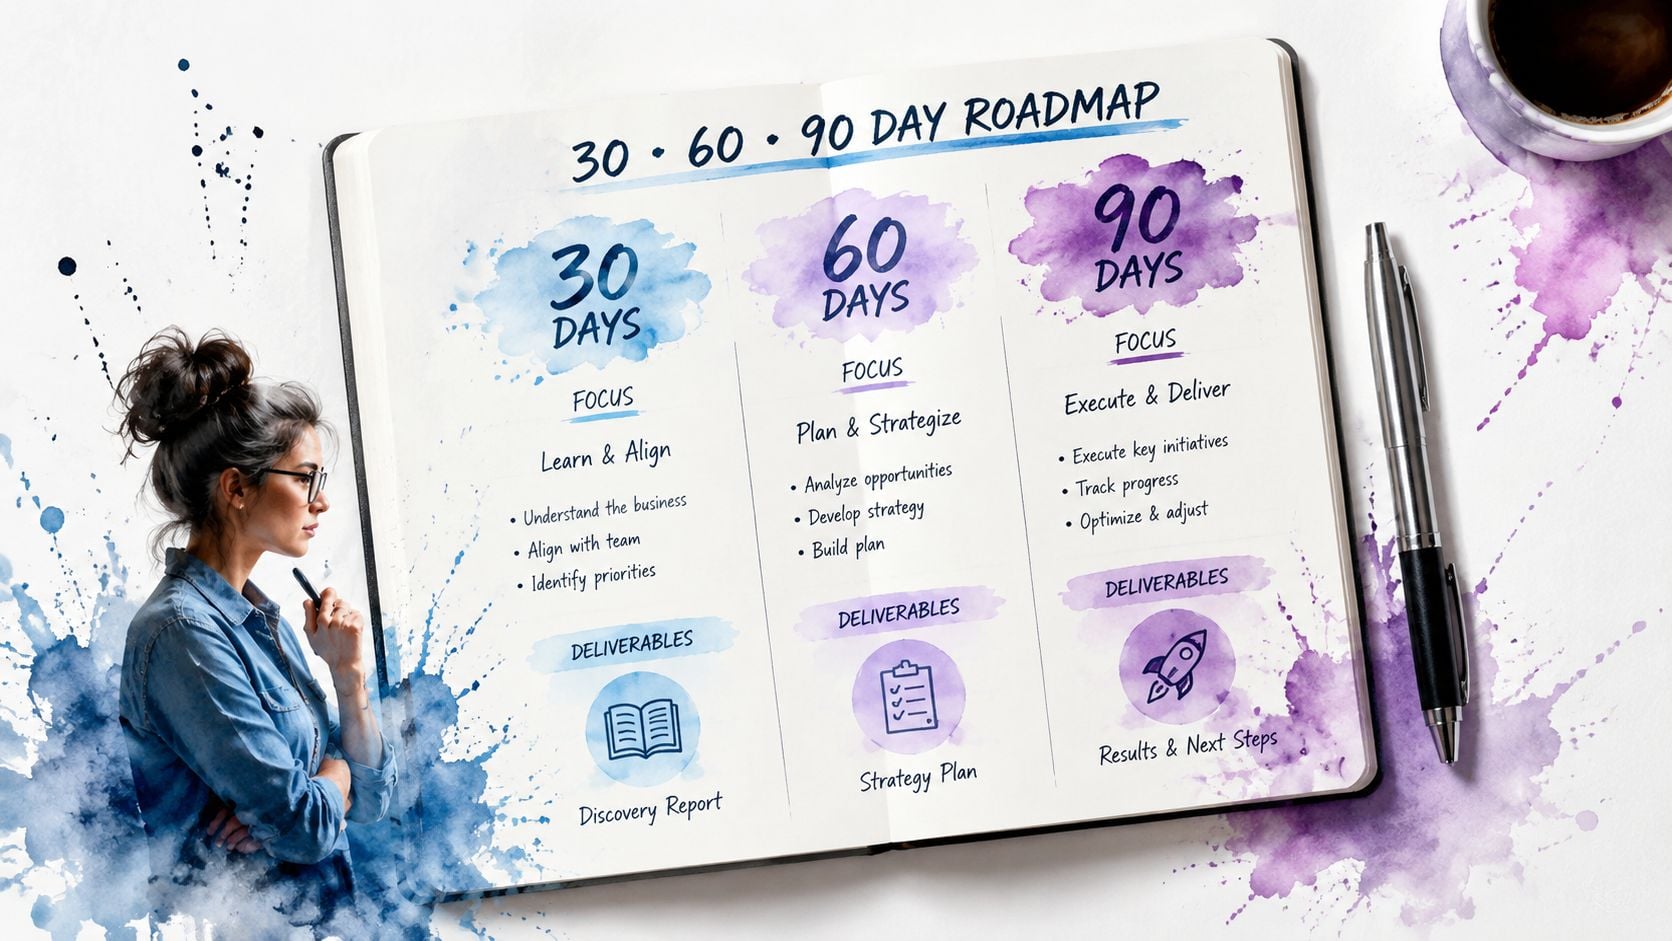
Days 31 through 60 improve demand quality and conversion
Use the second phase to test the parts of the journey that customers experience:
- Weeks 5 and 6: Run controlled hook, angle, offer, and landing-page tests. Document the hypothesis before launch.
- Week 7: Improve message match, form friction, qualification, checkout clarity, and mobile performance.
- Week 8: Review customer-level outcomes. Kill weak tests using acquisition cost, click-to-customer rate, and incremental lift, not surface engagement.
Every test should have an owner, a success criterion, a stopping rule, and a next action. Busywork isn't experimentation.
Days 61 through 90 extend value and tighten decisions
The final phase adds retention to the acquisition system:
- Weeks 9 and 10: Improve onboarding and activation paths, then identify the behaviors associated with repeat value.
- Week 11: Add relevant upsell, loyalty, referral, and win-back journeys.
- Week 12: Reallocate budget using segmented CAC, gross-margin payback, LTV:CAC, qualified-lead rate, activation, and retention.
Watch early warning signals. Rising CPMs with flat conversion, refund spikes, weaker lead quality, and payback creeping beyond your target can reveal a leaking system before blended CAC visibly rises again.
The Advertising Suite helps businesses connect paid acquisition, conversion improvement, CRM execution, and reputation management through a revenue-first operating model. Visit The Advertising Suite to request a growth consult and build the acquisition system as an extension of your team.