Stop reporting activity and start reporting revenue. A dashboard that celebrates clicks, impressions, and reach while leaving spend-to-pipeline and spend-to-revenue unanswered is decoration with a login screen. The right reporting automation tools connect advertising data to the business decisions that protect margin, improve customer experience, and create profitable growth.
Evaluate each platform by the decision it enables, not by the length of its feature list. Check data-source coverage, CRM connectivity, reporting depth, pricing fit, implementation effort, governance, and whether the system can distinguish a qualified customer from a cheap lead. That standard matters for agency-burned founders, scale-ready SMBs, and service-based franchises where reputation and follow-up can determine whether a lead becomes revenue.
The broader shift is already visible. McKinsey reported in 2025 that 88% of organizations were using AI in at least one business function, up from 78% the year before, according to reported AI automation adoption data. Reporting automation now sits inside that wider move toward automated data collection, summarization, anomaly detection, and dashboard generation.
An integrated CRM and reputation ecosystem can close the gap between advertising execution and customer experience. The Advertising Suite follows that growth-tech hybrid model, combining human-led strategy with a proprietary CRM and review management software so marketing performance doesn't stop at the form submission.
1. Google Data Studio, now Looker Studio
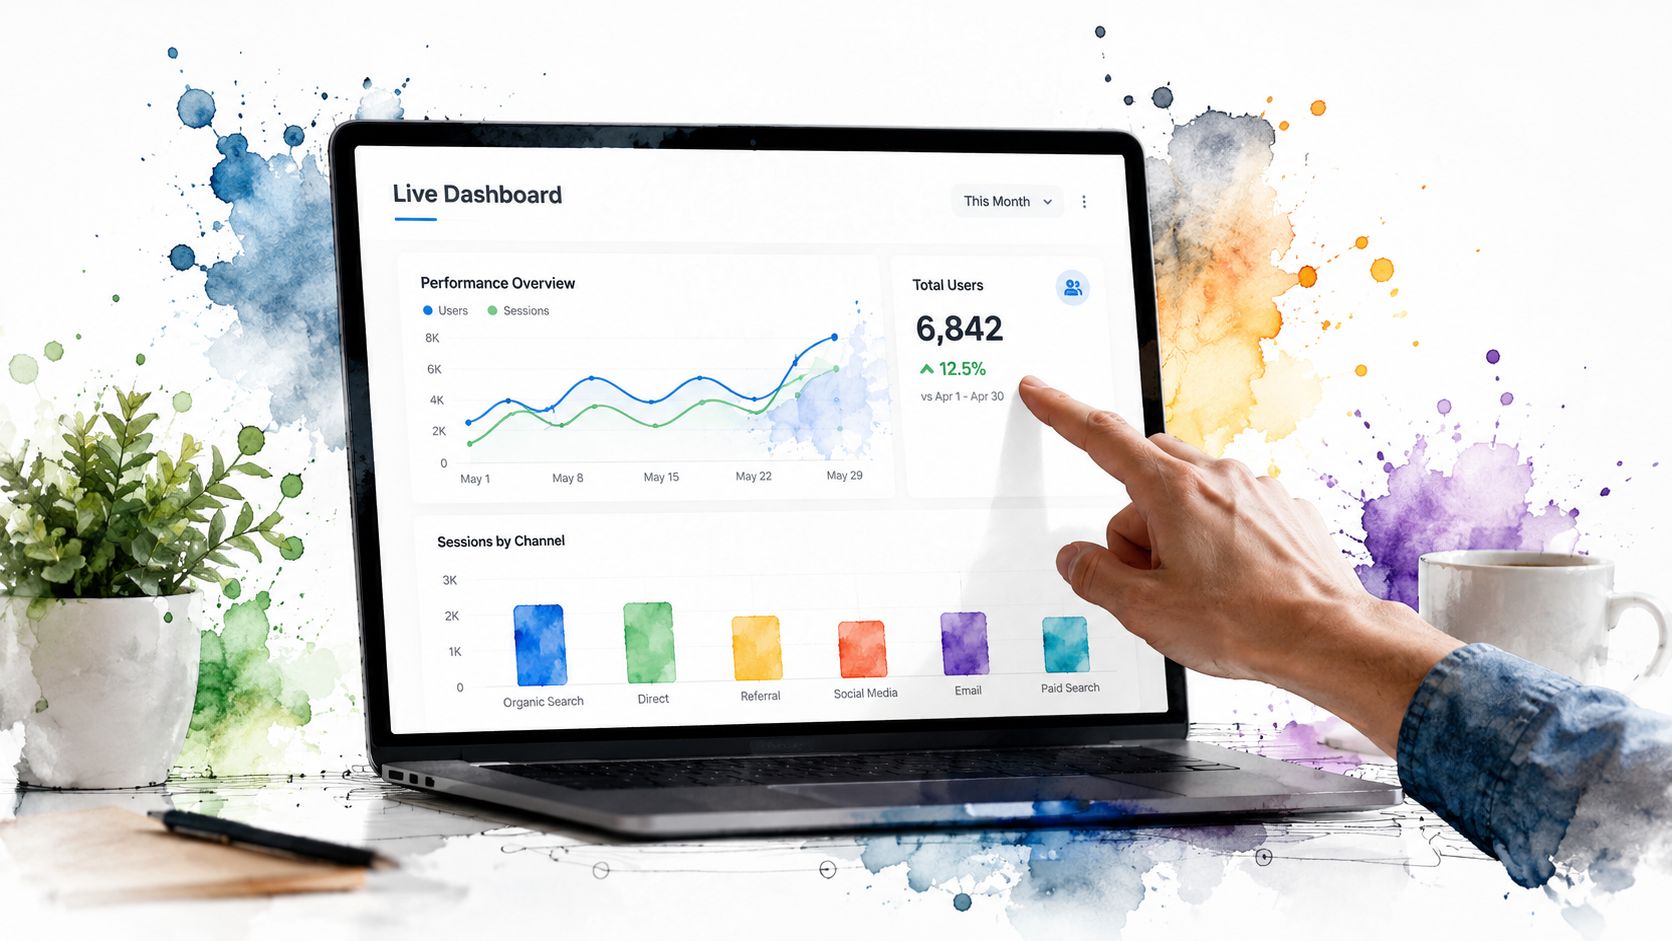
Looker Studio is a sensible entry point for teams that need a live view of advertising performance without purchasing enterprise business intelligence software. It works best when the company already relies on a connected advertising, analytics, search, and spreadsheet data stack. A comparison of automated reporting mechanics also identifies it as a free live-dashboard option for data from that ecosystem.
Its useful business question is direct: Are our campaigns generating enough qualified demand to keep funding them? Connect advertising, website analytics, search, and spreadsheet sources, then build views for the people who allocate budget and the people who improve campaigns. Leaders need cost, revenue, qualified conversions, and direction of travel. Operators need campaign, ad group, search term, landing page, audience, and location detail.
Build a dashboard that answers a money question
Put margin and customer value above engagement totals. Use calculated fields for measures such as revenue divided by advertising cost, then schedule a weekly report that gives the team a starting point for budget decisions instead of another manual PDF task.
- Executive view: Show spend, qualified leads, conversion rate, revenue, and trend movement.
- Operator view: Break down campaign, keyword, location, device, and landing-page performance.
- Decision view: Add scorecards that show where budget should increase, decrease, or pause.
A local service provider can use location reporting to check whether lead volume becomes booked work. An e-commerce team can combine campaign cost with purchase revenue. Agencies can create shared views for recurring client reviews, but a polished chart does not prove profitable growth.
For a practical explanation of how dashboards support performance decisions, read this guide to marketing dashboards. Looker Studio remains flexible and accessible. Its limits appear when tracking is inconsistent, connectors break, or lead quality never reaches the CRM. Use it for visibility, not as a substitute for revenue governance.
2. CRM-linked Reporting and Analytics
A CRM-linked reporting platform earns its place when the business question is “Which marketing activity created pipeline and closed revenue?” Its value comes from connecting first-touch activity, lead qualification, deal progression, and customer outcomes in one operating system. That creates accountability beyond ad-platform conversions.
The fit is strongest for service-based franchises, consultancies, B2B firms, and scale-ready SMBs where sales follow-up sits between inquiry and purchase. A lead is not revenue. The reporting model must show what happens between those events, and sales staff must record those stages consistently.

Set the CRM as the operating record
Define deal attribution before campaigns scale. If the team waits until year-end to decide what qualifies as a lead, the report may look tidy while its historical logic remains unreliable. Avoid a parallel spreadsheet that sales, finance, and marketing interpret differently.
Use the platform to answer three practical questions:
- Where does spend become a deal? Report acquisition cost by channel, not only cost per click.
- Which stage is failing? Separate inquiry, qualified lead, opportunity, closed customer, and lost deal.
- What affects customer experience? Include response speed, follow-up activity, and review quality where the data is available.
Revenue reporting software covers a wider contract-to-cash need. It can consolidate contracts, billing systems, and payment records so teams can review incoming money, recognized revenue, and outstanding amounts without chasing disconnected spreadsheets. This overview of revenue reporting software categories distinguishes CRM-based tools, ERP modules, subscription platforms, and AI-native revenue automation platforms.
Choose this category when the decision requires a CRM record, a sales action, and a revenue outcome. For a broader framework on connecting marketing systems, consult this marketing technology stack resource. Implementation takes discipline. Incomplete fields, inconsistent lifecycle definitions, and weak sales adoption will undermine even a well-designed report.
3. Data extraction and ETL connector tools
A connector tool earns its place by answering one operational question: “How are all channels performing together under one measurement framework?” It extracts advertising, analytics, email, commerce, and CRM data, then sends that information to dashboards, spreadsheets, or data warehouses.
The value is shared measurement, not another chart library. Advertising platforms may report conversions under their own rules, while finance needs actual revenue and blended acquisition cost. A connector centralizes the inputs. Your team still has to define attribution rules, reconcile CRM records, and decide which outcomes count.
Build a channel view finance can trust
Start with the decision the report must support. If the goal is budget allocation, standardize campaign names and add dimensions for business unit, location, offer, audience, or product category. If the goal is revenue accountability, connect campaign identifiers to pipeline stages and closed outcomes rather than stopping at platform conversions.
- Centralize sources: Send paid media, email, analytics, commerce, and CRM data to a common destination.
- Calculate blended performance: Compare total spend with qualified conversions, pipeline, and revenue.
- Preserve decision context: Keep channel, campaign, product, and location fields consistent enough for useful comparisons.
- Audit the inputs: Flag missing identifiers, duplicate conversions, and mismatched reporting windows before publishing results.
A commerce business can compare purchase revenue across paid channels. A B2B team can connect advertising activity with opportunity stages. A franchise operator can review lead quality and booked appointments by location. Each use case needs different CRM fields and customer outcomes, so one shared dashboard should not force every team into the same definition of success.
Use an accessible dashboard layer for day-to-day marketing questions, then send governed data to a warehouse when reporting volume, history, or finance review demands it. That setup adds implementation work. Naming conventions, field mapping, permissions, and refresh monitoring must be maintained.
Practical rule: Make data available across teams, then define revenue ownership before calculating return.
A multi-touch attribution model guide can help teams examine how several interactions contribute to a conversion. Treat the output as a decision aid, not proof of causation, when conversion windows, duplicate events, or customer records remain inconsistent. The connector provides reporting infrastructure. Governance determines whether the result deserves budget authority.
4. Tableau
An enterprise BI visualization platform earns its place when the decision is larger than weekly KPI delivery. It supports cohort analysis, trend investigation, forecasting, and interactive examination across varied datasets. The business question is “Which assumptions about growth, customer value, and channel economics deserve action?”
Start with the riskiest growth assumption, not a replica of every existing report. Test whether a channel creates profitable customers rather than inexpensive leads, then connect acquisition cost with lifetime value, payback, refunds, and retention where those records exist. This shifts reporting from attractive charts to budget decisions.

Use the platform according to the decision-maker:
- C-suite dashboard: Show revenue, profit contribution, customer value, and budget direction.
- Marketing dashboard: Show channel return, cohort quality, creative performance, and conversion progression.
- Analyst workspace: Retain the detail needed to test segmentation and attribution assumptions.
A retailer may compare advertising spend with inventory availability before increasing budget. A SaaS business may evaluate acquisition channels by customer cohort and downstream usage. A multi-location service business may ask whether lead sources produce repeat customers or only low-intent inquiries. These questions require CRM data, product or service outcomes, and customer experience signals, not media metrics alone.
The trade-off is implementation effort. Data definitions, warehouse structure, permissions, and analyst training determine whether the analysis can guide action. Reporting automation can surface the evidence, but governance decides whether finance and growth teams trust it. Choose this category when analysts are ready to connect marketing activity with profitable growth, not when the goal is a better weekly report.
The Advertising Suite's data-driven marketing solutions follow the same principle, connecting campaign execution to measurable business outcomes.
5. Agency client-reporting automation platform
An agency client-reporting automation platform solves a specific operational decision: Can the team provide consistent accountability across every account without adding reporting headcount? It collects marketing data, formats branded reports, and schedules delivery so account managers stop copying figures between systems.
That makes it a practical choice for agencies and internal teams with recurring reporting workflows. The report should connect spend, qualified demand, conversion quality, and the next commercial decision. Decorative charts add little value when clients still cannot see what changed or what the team will do next.
Start with the audience, then decide how much detail each view needs. Owners and executives need the financial direction. Channel specialists need campaign and audience evidence. Account managers need context they can explain in a client conversation.
- Client summary: Show revenue-linked KPIs, cost, conversion quality, and decisions.
- Channel detail: Provide campaign and audience data for optimization.
- Exception alerts: Notify the responsible person when a meaningful metric moves outside its expected range.
Use commentary to explain anomalies and assign an owner. A lead decline may come from tracking failure, budget changes, seasonality, landing-page friction, or a weaker customer experience. The report can flag the movement, but an accountable marketer must investigate and act.
Automated marketing reporting can combine advertising data, CRM records, and analytics inputs into a customer-journey view from ad interaction to revenue, as described in this marketing reporting automation overview. That view is only credible when naming conventions, conversion definitions, and CRM stages remain consistent.
Implementation still requires work. Fix the data model, permissions, and follow-up process before promising polished automation. The platform repeats the operating process already in place, including its gaps. Choose this category when reporting volume is slowing client service and the team can govern revenue definitions. A polished report earns attention. A defensible revenue explanation earns retention.
6. Funnelytics
A funnel mapping and journey analytics tool helps marketers decide where revenue is being lost, rather than rewarding the channel that reports the most traffic. It connects acquisition, conversion, and customer outcomes so teams can examine the path from first interaction to paid business. The decision it enables is “Where is the biggest revenue leak in the funnel?”
That question changes budget discussions. Cheap visits may produce few engaged prospects, while a quieter source can create more qualified opportunities, faster sales conversations, or stronger repeat purchases. Evaluate the tool by the action it supports, not by the number of views it can display.
Map the journey before moving budget
Standardize UTM parameters before building funnel reports. Use consistent campaign, source, medium, audience, creative, and location conventions across advertising, email, landing pages, and CRM records. Poor inputs produce polished but unreliable conclusions, and automation spreads those errors faster.
Create separate views for acquisition, conversion to customer, and repeat purchase. Compare campaigns by launch period, creative variation, audience segment, and customer quality. A service franchise can trace an inquiry to a booked appointment and paid job. A SaaS company can separate trial signups from trials that reach meaningful product use.
A funnel report should tell you what to fix next, not merely where the traffic came from.
Use the report to identify the highest-value break in the journey, then test one corrective action at a time. Change the landing-page promise, improve response speed, clarify the offer, or address a review problem that makes prospects hesitate. The tool does not create customer experience discipline. It shows where that discipline affects conversion.
Implementation depends on CRM field quality, event tracking, and agreed revenue definitions. Without those foundations, the funnel view becomes another attribution screen that favors vanity metrics. Set ownership for each stage and connect reported conversions to profitable customer outcomes.
This category fits teams that have reached diminishing returns from channel-level optimization. If every channel claims success, the journey view forces the harder question: which interactions survive through to profitable growth?
7. Enterprise marketing ETL and data pipeline platforms
An enterprise marketing ETL and data pipeline platform fits organizations whose reporting needs exceed simple connectors and spreadsheets. It extracts, transforms, and loads data from many marketing sources into centralized infrastructure, giving marketing operations and data teams a base for advanced analysis. The business decision is “Can we create a governed source of truth across marketing, sales, product, and finance?”
That decision differs from producing a weekly performance dashboard. International organizations may need shared definitions across regions, custom data models, lineage, validation, and warehouse access. They may also need to connect advertising activity with product usage, customer records, retail activity, and financial systems. The platform earns its cost when those connections support decisions about pipeline quality, customer experience, and profitable growth.
Treat governance as part of the product
A centralized pipeline requires named owners, documentation, validation, and failure alerts. Each metric needs a definition, source, refresh expectation, and responsible person. If a connector fails or a source changes its schema, the reporting layer should expose the issue instead of displaying stale figures.
- Model the business: Align marketing, CRM, revenue, and finance fields before building executive views.
- Track lineage: Record how each reported metric moves from its source through transformation to the dashboard.
- Validate outputs: Reconcile automated revenue and conversion totals with trusted operational systems.
Self-service reporting creates a governance conflict. Teams need flexibility, while leadership needs consistent metrics, lineage, and access controls. Research on enterprise reporting also notes that 89% of organizations manage multiple automation platforms, which makes orchestration and governance harder, as covered in this enterprise reporting tools analysis.
This category is excessive for a small business with a few stable sources. For a complex enterprise stack, underbuilding can produce unreliable decisions, duplicated pipelines, and weak internal trust. Choose it when the organization can maintain the operating model, data ownership, and implementation discipline that advanced infrastructure requires. For the integration layer behind that model, review this marketing data integration resource.
8. Microsoft Power BI
A Microsoft-ecosystem BI platform suits organizations that already centralize work in Microsoft infrastructure. It connects reporting across spreadsheets, CRM, sales, finance, and marketing systems, while supporting shared dashboards, scheduled refresh, and governed access. The business question is “How did marketing contribute to pipeline and revenue across the organization?” Choose this category when leadership needs one commercial view rather than separate channel reports.
The platform earns its place through the decision it enables: whether campaign activity produces qualified pipeline, closed revenue, and profitable customers. That requires consistent CRM fields, campaign naming, revenue definitions, and customer data. If those foundations are inconsistent, a polished dashboard only spreads disagreement faster.
Give each role the right view
Regional managers need their market. Executives need consolidated performance. Channel owners need campaign and funnel detail. Set access around responsibility, especially when teams share infrastructure but should not see every territory or customer record.
Natural-language exploration can help non-analysts investigate performance, but it does not replace governed definitions. Agree on what counts as a qualified lead, recognized revenue, retained customer, and profitable acquisition before building executive views. Connect the reporting layer to the CRM and finance process, then assign someone to maintain refreshes, permissions, and metric changes.
- Microsoft-first mid-market team: Consolidate spreadsheet, CRM, sales, and marketing reporting.
- CRM-led organization: Connect campaign activity to pipeline stages and sales outcomes.
- Distributed enterprise: Apply regional access controls while preserving shared KPI definitions.
Implementation friction is real. IT may control connectors and security, while marketing needs faster answers and sales needs trustworthy attribution. Set ownership early, document the decision workflow, and test revenue totals against operational records before executives rely on the dashboard.
Use this category when existing Microsoft infrastructure reduces setup effort and the organization can support governance. Avoid it when the business has only a few stable sources or lacks an owner for data models, access, and refresh operations. The dashboard is not the strategy. It is the operating layer for accountable growth.
9. Lightweight SMB dashboard platform
A lightweight SMB dashboard platform earns its place by helping managers act without waiting for an analyst. It brings marketing, sales, and customer-service activity into accessible views, while keeping setup manageable for teams that lack dedicated data engineers. The business decision is “Which numbers require action today, and who owns the response?”
Start with the decisions, not the feature list. A local franchise manager may need lead volume, booked opportunities, review activity, and response status. An owner needs revenue, acquisition cost, customer value, and channel direction. A creative specialist can monitor engagement and clicks, provided those measures do not crowd out commercial outcomes.
Build views around operating decisions
Use a shared live dashboard instead of static files that become outdated after delivery. Organize views by responsibility, then add alerts for events that require human attention, such as a conversion decline, unusual spend, or missing lead activity.
- Owner view: Show revenue, acquisition cost, customer value, and outcomes that affect cash.
- Location view: Show qualified leads, appointments, reviews, and follow-up status.
- Marketing view: Show channel cost, conversion rate, creative response, and landing-page performance.
The dashboard is only as reliable as its source data. If the CRM does not record lead status, or the review process sits outside the normal workflow, the platform may display activity without clarifying profitable growth. Standardize tracking from ad click to customer conversation, define the handoff to sales or service, and check that campaign data connects to customer outcomes.
Implementation remains light, but it still needs an owner. Someone must maintain connectors, naming conventions, permissions, and alert rules. Without that discipline, a simple dashboard becomes another untrusted report.
Choose this category when the team needs visibility quickly, its sources are limited, and managers will use the views to make daily decisions. Avoid it when the business requires governed enterprise analytics, complex attribution, or detailed customer-level modeling. For an SMB, restraint can improve adoption. The right dashboard is the one that links marketing activity to customer experience and profitable action.
10. Looker on Google Cloud
A governed cloud BI modeling platform earns its place when reporting decisions span departments, products, and markets. Its centralized model keeps revenue, customer, campaign, opportunity, retention, and conversion definitions consistent, while reusable views can serve internal teams or customer-facing applications. The key question is “Can every team use trusted metrics as the organization grows across products, markets, and workflows?”
This category suits data-mature organizations with analysts, technical owners, and enough reporting complexity to justify formal governance. Marketing may need channel performance, sales may need pipeline visibility, and product may need usage and retention. Shared business logic connects those views without letting every department create its own version of revenue.
Make the model the product
Start with definitions, not dashboard design. Establish the rules for cost, qualified leads, pipeline, revenue, customer value, and retention before building a large reporting library. A metrics dictionary settles disagreements before they reach an executive meeting.
- Central model: Store approved business logic for financial and customer metrics in one governed layer.
- Change control: Test model updates away from production views, then publish only reviewed changes.
- Embedded reporting: Place relevant views inside internal tools or customer workflows when another reporting destination would create friction.
- Governed self-service: Let users explore approved data without changing the definitions behind key metrics.
Implementation requires more than connecting data sources. The organization must assign owners for model changes, permissions, testing, documentation, and access requests. CRM fields also need clear ownership, because inconsistent lead stages or customer records will undermine even well-governed analysis. This work slows the initial rollout, but it prevents every team from rebuilding the same metric differently.
AI-generated narratives and conversational reporting introduce another control problem. Teams need to validate generated explanations, inspect citations, and retain an audit trail before using automated insights in revenue or customer decisions. This analysis of AI report generation highlights that gap, including the reported 80% adoption of conversational AI tools among enterprise analytics teams.
Choose this platform category when trusted modeling must support many users, workflows, and decisions. Do not buy it to repair inconsistent campaign tags or unclear CRM definitions. Fix those foundations first, then invest when governance can improve accountability for profitable growth.
Top 10 Reporting Automation Tools, Feature Comparison
| Tool | Core capabilities | UX & speed | Value proposition | Ideal for | Price & USP |
|---|---|---|---|---|---|
| Google Data Studio (Looker Studio) | Real-time Google connectors, customizable dashboards, data blending | Free, intuitive for basics; advanced customizations require time | Centralized, no-cost Google-centric reporting & scheduled reports | Agencies, SMBs invested in Google Ads/GA | Free; best for Google ecosystem, limited non-Google connectors |
| HubSpot Reporting & Analytics | CRM-linked attribution, lead scoring, pipeline dashboards | User-friendly UI; proper setup required for accuracy | Connects marketing to closed revenue; removes marketing-sales silos | SMBs & scale-ups optimizing for revenue | Mid–premium pricing; CRM + reporting in one platform |
| Supermetrics | 100+ native connectors, automated ETL to Sheets/Data Studio/BI | Moderately technical; quick once configured | Single source of truth for multi-channel ad data | Agencies, multi-channel performance teams | Usage/data-volume pricing; broad connector coverage |
| Tableau | Advanced visualization, predictive analytics, cohort & funnel analysis | Powerful but steep learning curve; needs analysts | Deep, scalable BI for forecasting and complex insights | Enterprises & data-driven scale-ups | High licensing & implementation cost; top-tier visualization |
| Whatagraph | 50+ integrations, white-label client reports, scheduled delivery | Agency-oriented, fast setup, templated workflows | Automated client-branded reporting that scales agency ops | Digital marketing agencies & white-label resellers | Usage-based pricing; white-label automation for client reporting |
| Funnelytics | Multi-touch attribution, funnel visualization, cohort comparisons | Visual and approachable; requires clean event/UTM setup | Reveals customer journey and revenue leaks across touchpoints | E‑commerce, SaaS, service businesses tracking funnels | Mid-market pricing; clear funnel mapping and attribution focus |
| Improvado | 500+ connectors, ETL/transform, warehouse deployment, governance | Enterprise setup requiring data engineering | Enterprise-grade data infra for custom models & governance | Large enterprises with data science teams | High cost; robust ETL, governance, and scale |
| Microsoft Power BI | Drag-and-drop dashboards, Excel/Azure integration, AI Q&A | Moderate learning curve, familiar to MS users; quick wins | Cost-effective BI for Microsoft-centric stacks, scalable | Enterprises & mid-market MS-centric organizations | Lower cost vs Tableau (with MS licenses); strong MS ecosystem fit |
| Cyfe | 60+ widgets, drag-and-drop dashboards, public links | Very user-friendly; fast implementation (days) | Affordable, professional dashboards for non-technical teams | Growing SMBs, small agencies, in-house marketing teams | Low-cost plans; simple, fast dashboards (limited advanced analytics) |
| Looker (Google Cloud) | LookML modeling, governed metrics, embedded analytics | Requires LookML/data engineering; longer rollout | Single source of truth with governance and embedded BI | Enterprises, data-mature scale-ups prioritizing governance | High licensing + implementation; modeled metrics and embedding |
Choose the Reporting Stack Your Revenue Model Can Support
Choose the platform according to the decision your team must make repeatedly. Looker Studio or Cyfe fit accessible dashboard automation for small teams and growing SMBs. Whatagraph fits agencies that need repeatable, branded client delivery. Supermetrics fits multi-channel extraction into an existing dashboard or warehouse. HubSpot or Funnelytics fit CRM accountability and customer-journey analysis.
For Microsoft-centric organizations, choose Power BI. For advanced enterprise requirements, choose Tableau, Looker, or Improvado, depending on whether the priority is analyst-led discovery, governed self-service, or complex marketing data infrastructure. Don't buy an enterprise platform to solve a tracking problem, and don't expect a lightweight dashboard to provide enterprise governance.
A staged deployment keeps implementation practical:
- Define revenue KPIs: Agree on qualified lead, opportunity, customer, revenue, acquisition cost, and customer value.
- Standardize tracking: Apply consistent UTM conventions, naming rules, location fields, and campaign identifiers.
- Connect core sources: Start with Google and Meta data, then add analytics, billing, and other advertising sources.
- Map leads into the CRM: Record lifecycle stage, owner, follow-up status, opportunity value, and customer outcome.
- Assign dashboards by role: Give executives the commercial view, operators the optimization view, and analysts the governed detail.
- Review implementation health: Check connector freshness, access control, source changes, duplicate records, and metric lineage.
Don't automate a report just because someone sends it every week. Automate the report when it supports a recurring decision and the underlying data can withstand scrutiny. Automated reporting tools are designed to collect, organize, and visualize data without ongoing manual intervention, and they commonly generate scheduled, customized reports around key metrics, including accounting workflows such as balance sheets, budget-versus-actuals, and revenue performance reporting, according to this automated reporting tools explanation.
The measurement loop should be straightforward. Advertising creates demand, the CRM records what happens next, the customer experience affects conversion and retention, and finance confirms whether the outcome was profitable. Review cost, conversion quality, pipeline progression, customer value, and revenue. Clicks can remain in the report, but they shouldn't be allowed to run the meeting.
The Advertising Suite applies that revenue-first logic through a growth-tech hybrid model. The team combines strategic creative, omni-channel execution across Google and Meta, conversion rate optimization, CRM infrastructure, and reputation management so advertising performance connects to the experience customers receive.
Request a Demo or Book a Growth Consult when you need a practical review of your reporting and revenue measurement stack. If you want the broader operating system, Explore the Membership, which includes a 25% discount on services and access to the proprietary CRM.
The Advertising Suite helps businesses connect advertising data, CRM activity, reviews, and customer experience inside a results-first growth system. Visit The Advertising Suite to Request a Demo or Book a Growth Consult, and turn reporting automation into a clearer path from spend to profitable revenue.